|
|
|
|||

Department of Agriculture and Food Systems
|
||||
|
||||
|
|
|
|||
Department of Agriculture and Food Systems
|
||||
|
||||
|
|
Agribusiness Review - Vol. 11 - 2003Paper 3 Changed Payment System for Wheat Grades: Consequences for Farming Systems in the Central West of NSWDean Patton - NSW Agriculture, Agricultural Research Station, Trangie, NSW
Abstract The new AWB Ltd payment system for wheat grades has changed the incentives for farmers to grow and market wheat varieties in Australia. Based around standard quality characteristics, the payment system provides incremental premiums and discounts for deviations in protein and screenings around this standard. The aim of this paper is to compare the optimal crop-pasture rotation using the previous cliff-face pricing structure with the new premiums and discounts pricing structure. The optimal rotations are analysed by applying a linear programming model of farming systems in the Central West of NSW (PRISM Condobolin). To assess the robustness of our results, optimal rotations are also compared for a range of cereal and oilseed prices. It was found that the new pricing structure favours increased cereal production by reducing the relative economic importance of beneficial rotation crops, particularly canola. This is an important finding, given the need to develop and promote more ecologically sustainable farming systems that are not dominated by cereal production. Key words: linear programming, New South Wales, farming systems, price AWB Ltd has introduced a different system of payments for wheat grades, where payments within grades are based on protein and screenings levels (AWB 2002). The new AWB Ltd payment system has changed the incentives for farmers to grow and market wheat varieties in Australia. Based around standard quality characteristics, the payment system provides incremental premiums and discounts for deviations in protein and screenings around this standard. The aim of this paper is to compare the optimal crop-pasture rotation using the previous cliff-face pricing structure with the new premiums and discounts pricing structure. It is important to consider the implications for crop rotations of changing the pricing structure for rotations producing wheat at the grade margin. Under the old pricing structure, it was not uncommon for prices to fall by $20-40/tonne, sometimes up to $100/tonne (AWB pool estimates 1993-94 and 1994-95), when moving from Prime Hard (13% protein and above) to Australian Hard (11.5% to 12.9% protein) grades. Price reductions of this magnitude can significantly reduce the profitability of rotations producing wheat over a range of quality grades. For example, a four-year continuous wheat phase after a four-year pasture phase is likely to produce a range of wheat yields and proteins. Both yield and protein are likely to reduce as more wheat crops are grown in sequence, mainly as a result of nutrient run-down and increased disease incidence. It is likely that protein may be reduced by between 1% to 4 % from the top grade for rotations with a long cropping phase dominated by cereals. Additional synthetic fertiliser applications will partially redress the protein and yield decline, but diseases and weed herbicide resistance are likely to impact on both yields and protein. In these circumstances, the payment system for wheat is likely to influence the optimal farming system. Shifting to an incremental pricing structure is likely to alter the relative economic returns from different crop rotations. For example, the point of substitution between wheat and canola will change depending not only on their relative profitability of each but also by the expected returns from subsequent crops in the cropping phase. Incremental pricing structures are not uncommon in the Australian grains industry. For example, canola has had an incremental premium and discount for oil content for many years and a fixed rate protein premium has been paid for wheat above base grades for much of the 1990's. The complication for wheat pricing is that deviations from a base quality attract a premium or discount for both protein content and screenings. Simply, a drop in wheat quality below this base, for example 12.5% protein for a Prime Hard variety, will now attract a discount of $6.00 (AWB, as at 7 January 2002) from the Prime Hard base price (set at 13% protein and 5% screenings) if delivered to the AWB pool. Under the cliff-face pricing structure the wheat would have been delivered to the Australian Hard pool for a much reduced payment. The issues relating to binning grades and varietal grades, and to cash prices and pool prices, have attracted significant attention by grain market analysts recently, but are not addressed in this study. It should be noted that price increments within grades, like price differentials between grades, vary over time so that the incentives of the pricing system are regularly changing. In this paper, a whole-farm linear programming (LP) model, PRISM Condobolin (Faour et al . 1999), is used to determine the optimal rotation under the two pricing structures for the Central West of NSW. The aims of this analysis are: (a) to examine whether the optimal rotation is changed by the change in pricing system, and (b) to test the robustness of the optimal solution over a range of cereal and canola prices for both the new and old pricing structures. Agriculture and Farming Systems in the Central West of NSW The Central West region of NSW includes the Lachlan, Bland, Narromine, Parkes, Forbes, Weddin, Gilgandra, Dubbo and Wellington local government areas (Patton and Mullen 2001). Rainfall across the region varies between 400 and 700mm and is generally non-seasonal. The region produces a range of grain and livestock products including food grains, feed grains, wool, mutton, lamb and beef. However, management emphasis has shifted since first settlement in the 1820s, mainly between sheep and wheat production depending on changing market conditions, government policy, new technologies and establishment of infrastructure. The majority of the agricultural land in the region is used for dryland agricultural activities but irrigation activities make a major contribution to the region's agricultural production and rural economies. The focus of this paper is on the dryland farms in the Central West. Wheat and canola are the primary crops grown following a pasture phase, usually in a long fallow situation (Patton and Mullen 2001). Farmers in the eastern part of the Central West would normally have a sequence of consecutive crops during a cropping phase, whereas farms in the western part of the region are more likely to utilise long fallow for each crop in a cropping phase. Pastures are normally undersown with the last crop in the cropping phase, usually a cereal. Common livestock enterprises include sheep for wool production, merino ewes and wethers, and cattle for yearling and bullock beef production. Although farms may adopt similar enterprises, performance varies between farms depending on the farmer's management skills and unknowable future events (drought, floods, and frost). Those skills are reflected in choices of breed, bloodline, joining times, tillage technique, sowing date, fertiliser application, and weed and disease control. The combination of enterprises adopted on farms in the Central West is influenced by a number of factors. Not only is it influenced by their profitability but also by farmers' skills (eg animal husbandry, mechanical), their perception about the future, their experience, attitude to risk, culture and family influence, proportion of arable and non-arable land, the quantity and quality of information available and the interactions between enterprises. Therefore, there is no one combination of enterprises that is going to suit or be optimal for every farm. However, the analysis can help identify the optimal set of enterprises for a typical farm in the region. The analysis is carried out using a whole-farm linear programming (LP) model, PRISM Condobolin (Faour et al . 1999) developed for the Central West of NSW. The LP model is able to compare a combination of enterprises or rotation with an alternative combination of enterprises or rotation. The optimal solution is the rotation that maximises the farm operating surplus objective while satisfying all the constraints imposed, such as land, labour and capital limitations. PRISM Condobolin specifically relates to farms in the Lachlan local government area but the insights are relevant to the much wide region. PRISM Condobolin has 52 mixed crop and livestock rotations represented, which are of interest to landholders in the Central West (see Patton and Mullen 2001 for a more detailed description of the settings used in the model). In all cases, rotations are made up of both a pasture phase and a crop phase. The length of the pasture phase may be as short as two years or as long as six years; whereas the length of crop phase can be as short as one year or as long as five years. For example, a six-year rotation might have two years of pasture followed by four years of crop, or alternatively five years of pasture and one year of crop. In addition, whole rotations can be as short as four years or as long as 11 years. Crop options include wheat, canola, lupins, barley and oats; livestock options include merino wethers, self-replacing merino ewes and a first cross lamb enterprise. A mixed pasture sward of lucerne, rose clover and annual medics is assumed in all rotations, being undersown with the last crop in the cropping phase. By applying LP techniques, important interactions between enterprises can be captured in detailed biological and economic functions for each rotation. Some of the interactions that are important in the farming systems of the Central West include: · the trade-off between the length of pasture and the amount of nitrogen fixed; · the resultant crop yield and quality; · changes in labour requirement; · livestock numbers and length of pasture phase; · returns to scale from capital equipment (woolshed and machinery); and · fertility decline, disease build-up and potential weed herbicide resistance build-up during the cropping phases. Although it is difficult to attribute a response for each interaction, this model incorporates the sum of their effect, consistent with other LP models that are interested in cropping and livestock interactions (Kingwell and Pannell 1987). There are many well-documented examples where LP models have been successfully applied to farming systems issues (Pannell 1997, Kingwell and Pannell 1987). It is important that the results of the analysis in this paper are interpreted with an understanding of the limitations of the methodology. One aspect of this type of analysis is the use of expected values for input prices and rotation interactions. In reality, commodity price and many of these interactions are uncertain. For example, future commodity prices are a function of future supply and demand, which will be determined by unknowable future events such as drought and floods. Future crop yields and the amount of nitrogen fixed by lucerne are uncertain, responding to unknowable seasonal fluctuations. Sensitivity analysis was applied to assess the robustness of the optimal crop-pasture rotation for changes in wheat and canola price. Although this type of sensitivity analysis has allowed some consideration of the consequences for a range of price it has not considered the shape of the price distribution inherent to a range of commodities. In addition, the range of prices tested is based on historical price movement that is no indication of any future price movement. This analysis has not attempted to assess the dynamic implications of adopting particular rotations that are likely to change a resource over time. For example, a rotation with a short pasture phase, say two years, followed by a longer cropping phase, of say three years dominated by a cereal monoculture, may never be sustainable. The benefits associated with the pasture phase such as building soil structure, building soil organic matter and drying down water tables may be outweighed by the costs incurred in the cropping phase such as disease build-up, herbicide resistance, fertility decline and ground-water accessions. Therefore, the results should be considered as an indication of the likely outcomes rather than a definitive prescription for land managers and a forecast of producer behaviour. Additionally, while comparisons between whole rotations are enabled with this type of analysis, we only get a view of each of the rotations once in equilibrium. If the change in rotation has an impact on soil fertility, for example, which can take many years to work through the system, then comparing rotations using this technique may be an inadequate basis from which farmers can make these important investment decisions. While expected values for yields, protein and screenings are used, in reality these are dependent on stochastic variables such as rainfall and temperature, which vary significantly between years. This analysis has not attempted to consider the stochasticity of these variables but rather provide, using existing tools, an indication of the likely rotation choices farmers are likely to adopt under both pricing structures. More sophisticated techniques are required to incorporate these stochastic relationships (Pannell 1997). Definition of Differences between Payment SystemsUnder the previous "cliff-face" payment system, the price received for wheat was determined by the protein level test results, after meeting minimum standard weight, colour and screening characteristics, for each truck load of wheat delivered. The wheat, based on these characteristics would generally be allocated into an Australian Prime Hard (APH), Australian Hard (AH), Australian Premium White (APW), Australian Standard White (ASW), General Purpose (GP) or Feed wheat binning grade. For example, a load of wheat of a suitable variety would be accepted as APH if the tested protein was above 13.0%, whereas if protein tested between 11.5% and 12.99% it would only be accepted as AH. A base price was set for wheat accepted for each grade. An additional fixed premium of $0.50 per 0.1% protein above the benchmark for each grade also applied in the late 1990's. For example, a load of wheat testing 12.9% would receive the base price plus $7/tonne for AH quality whereas a load of wheat testing 13.0% protein would received the base price for APH. Farmers often deliver wheat over a range of protein levels in any one season. For instance, paddocks may vary by soil fertility, disease incidence and weed populations depending on cropping history and fertiliser application ultimately influencing protein levels. It is likely that a paddock with a cropping phase dominated by wheat will produce wheat of lower average protein than a paddock with a cropping phase that includes pulse and oilseed crops such as lupins and canola. PRISM Condobolin presents the yield and protein estimates for all crops based on the paddock rotation history. For example, wheat yield and protein estimates are presented in Table 1 for three of the 52 rotations in PRISM Condobolin. Table 1: Wheat Yield and Protein Levels for Three Rotations, PRISM Condobolin
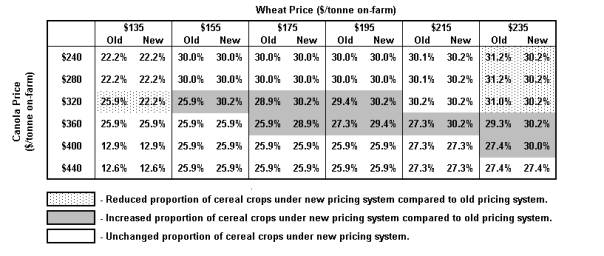
a 5 years of pasture-wheat-wheat-barley b 5 years of pasture-canola-wheat-barley c 5 years of pasture-wheat-lupins-wheat The yield of the first crop after pasture for Rotations 1 and 3 is 1.91 t/ha at a protein level of 15.0%, which would be accepted on delivery into the APH bin at the silo. However, in the second year after pasture yield and protein drop for Rotation 1 to 1.43 t/ha and 12.7% respectively. In this case, the wheat delivered would only be accepted as AH. Note that the yield estimate for Rotation 2 is higher than the yield estimate for Rotation 1 in the second year of crop, because of the rotational benefits that canola (the first crop after pasture) provides by reducing disease carryover. Also note that both the yield and protein estimates for the third crop in Rotation 3 are higher than that for the second crop in Rotation 1, because of the increased fertility and disease break benefit that a lupin crop provides to a cereal-dominant cropping phase. In this case, Rotation 3 would only be delivering APH quality wheat. Under the old pricing system, the payments would simply reflect their grades into which the wheat is received. Under the new payment system, the price received for wheat is determined by the wheat variety, protein level tested, proportion of screenings and minimum standard weight and colour characteristics. The variety determines the grade of wheat delivered. For example, once satisfying minimum colour and weight specifications, Janz (an APH variety) will be received as APH, whereas Diamondbird (an AH variety) will only be received as AH. Based around standard quality characteristics for protein and screenings premiums and discounts are applied when above or below these standards. In this study, it is assumed that APH wheat varieties are grown at all stages of the cropping sequence. For example, Rotation 1 in Table 1 would receive a premium for protein for the wheat delivered at 15.0% protein and a discount for the wheat delivered at 12.7% protein. The PRISM model was run for both the new and old payment systems, and the results compared. As feed oats and barley prices are influenced by the feed wheat price, which is also influenced by prices for other grades of wheat, a fixed discount of $65/tonne and $45/tonne respectively is applied to the APH price. ResultsResults for Current AWB Ltd Pricing System PRISM Condobolin was run at the base settings for the new wheat pricing system (base wheat price of $195/t on farm for APH at 13.0% protein and 5% screenings). The optimal rotation was 6P-W-L-W-B (6 years of pasture followed by wheat-lupins-wheat-barley). Being a ten-year rotation, of which six years is pasture, 60% of the farm is under pasture at any one time. The total farm operating surplus for that rotation was $61,238. This optimal rotation varies with the wheat price (Figure 1). As the base wheat price increases from $135/t on-farm to $235/t on-farm, the optimal rotation changes from 6PWLW, to 6PWLWB at approximately $155/t on-farm. The optimal rotations are also likely to change as relative profitability of alternative crops to wheat, such as canola, change as both the cereal and canola prices change (Figure 2). Each square in the surface represents a point relating to the area of pasture as a percentage of the whole-farm in the optimal solution, represented on the vertical axis, for a particular combination of wheat and canola price. Where there is a flat surface the area of pasture hence rotation in the optimal solution is unchanged for prices in that range. Therefore the rotation is robust for the price changes bounded by the flat surface. For example, the 6PWLWB (6 years of pasture followed by wheat-lupins-wheat-barley) rotation is optimal for wheat prices above $155/t on-farm and canola prices below $360/t on-farm. However, if canola price rose to above $360/t on-farm and wheat price stayed at $195/t on-farm, then the six years of pasture canola-wheat-wheat-lupins-barley rotation is optimal. An important point to note is that although the crops in the cropping phase change in response to their relative profitability, a pasture of six years in length is robust for all price combinations tested. Results for Previous AWB Ltd Pricing System PRISM Condobolin was then run using the old "cliff-face" payments system (base wheat price of $195/t on farm). The optimal rotation again was 6PWLWB (6 years of pasture followed by wheat-lupins-wheat-barley). The operating cash surplus for that rotation was $53,527. The optimal rotation at wheat prices below $165/t on-farm was the 6PCWWLB (6 years of pasture followed by canola-wheat-wheat-lupins -barley). Operating cash surplus was consistently lower for all wheat prices under the old pricing system when compared to the new pricing system. The key difference between the impacts of the pricing systems is seen when the prices are varied across alternative crops in competition with wheat in the rotation, such as canola. The optimal rotations for a range of cereal and canola prices using the old cliff-face wheat pricing system are presented in Figure 4. Under this pricing system the 6PWLWB (6 years of pasture followed by wheat-lupins-wheat-barley) rotation is optimal for wheat prices above $155/t on-farm and canola prices below $320/t on-farm. Once canola prices rose above $320 on-farm, then the six years of pasture canola-wheat-wheat-lupins-barley rotation is optimal. A comparison of Figures 2 and 4 shows that by moving to the new premiums and discounts pricing structure, the 6PWLWB (6 years of pasture followed by wheat-lupins-wheat-barley) is optimal to a higher canola price than was optimal under the cliff-face pricing structure. It shows that a threshold price of $360/tonne on-farm for canola is needed before rotations with canola are desired compared to $320/tonne on-farm under the old pricing structure. In this case, cereal production is favoured over canola for a larger range of canola price. This difference is further illustrated in Tables 2 and 3, where the optimal proportion of cereal and canola outcomes across the range of both wheat and canola prices is shown for the two pricing systems. It is apparent that shifting to the new pricing structure favours cereal production for a higher canola price than under the old pricing structure. Table 2 shows that, for wheat prices above $195/t on-farm a higher proportion of cereal production is now desirable for canola prices between $320 and $360/tonne. For wheat prices between $155 and $195/tonne, canola prices need to be less than $360 before 30% of farm is sown to cereals. Table 2: Optimal % of Cereal Crops for Changing Wheat and Canola Prices: Results for Both Pricing Systems
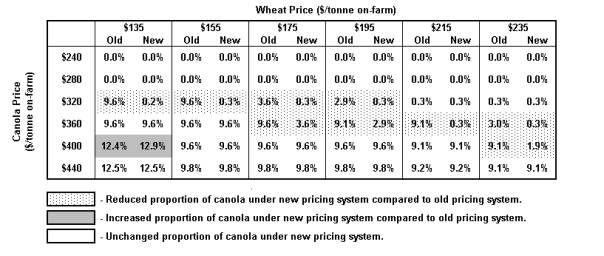
Table 3 confirms the finding that the threshold canola price at which cereal production is substituted for canola production increases by approximately $40/tonne. In other words, for wheat prices of $195/tonne, the optimal solution does not include canola until canola price reached $360/tonne under the new pricing system whereas optimal solution under the old pricing system does not include canola until $320/tonne. Table 3: Optimal % of Canola for Changing Wheat and Canola Prices: Results for Both Pricing Systems
Discussion of the ResultsThe objective of this paper was to determine the impact if any of the new wheat pricing structure on the rotations adopted by farmers. At the expected base prices for wheat and canola, the optimum rotation is unchanged by the new pricing system, although the farm operating surplus is estimated to increase by 14%. However, by changing to the new premiums and discounts for proteins and screenings pricing structure, the threshold price where rotations with canola were included in the optimal solution was increased. It is apparent from the analysis that shifting to an incremental pricing structure is likely to alter the relative importance of cereal production and favour rotations with more cereal rather than beneficial rotation crops, particularly canola. The concern is that by increasing the proportion of land planted to cereals will increase the likelihood of weed resistance to chemicals and disease impact on yields reducing the overall sustainability of the system. The results of this analysis show that the optimal length of pasture for both the new and old pricing systems was unchanged, although the optimal length of the cropping phase is changed for some price combinations. Additional analysis may be warranted to test the sensitivity of these results to the variability between enterprises based on their individual production and price risks. For example, the characteristics of production and price for the wheat enterprises are different to those of the canola or the lupin enterprise. While it was recognised that significant variability exists between farming systems in the Central West, a majority of landholders adopt a mixture of livestock and cropping enterprises. However, a small proportion of farmers adopts crop-only or livestock-only activities. The focus of this report was on the mixed systems. These farming systems are characterised by livestock activities dominated by sheep for wool production (although cattle are increasing in importance) and wheat production in the cropping phase. As mentioned, many rotational changes involve a transition period, where the system takes time to adjust. More sophisticated analytical techniques are required to incorporate the adjustment phase. There are difficulties when comparing rotations, as there is no firm biological evidence that all of the rotations considered are sustainable, as is assumed for a rotation in static equilibrium. For instance, at high cereal prices a cereal monoculture might be most profitable when compared to all other alternatives. Although reasonable from a profit maximising landholder perspective, this rotation may be at a net cost to society in the long run. For analyses that consider the social perspective, more sophisticated techniques should be applied. Therefore there are advantages with using whole-farm LP models for this type of analysis such as their ability to include biological relationships, but there are also disadvantages that limit their use. These include the use of expected values for many risky variables, such as commodity price and yields, and rotations assumed to be in static equilibrium. A rotation in static equilibrium assumes that this rotation will always achieve the production estimates for yield and pasture growth etc. through time. Although a partial evaluation of commodity price variability was conducted, the characteristics of price risks for all commodities were not included. Also, research data for the biological relationships of all rotations are limited, hence these results should be continually tested as new data become available. ConclusionsThe objectives of this paper were to apply the PRISM Condobolin linear programming model to determine the impact of changing the payment structure for wheat on the rotations adopted by farmers in the Central West of NSW. In this analysis, the model was used to compare the optimal outcomes under the different pricing structures for wheat, and found no difference at the base price levels in the optimal rotations. However, the model was also used to consider the interactions between the length of pasture, livestock numbers, labour requirements and crop yields and quality, to determine the optimal rotations for a range of prices under both the old and new structures. It was found that the new pricing structure favoured increased cereal production by resulting in a higher threshold canola price at which rotations with canola are optimal. These findings have important implications for the farming systems in the Central West of NSW, and possibly for other wheat-growing regions. The new pricing system has been shown to lead to improved outcomes, in terms of higher cash operating surpluses, for the farmers in the Central West. However, the new pricing system for wheat is also found to be likely to reduce the incentives to include alternative crops such as canola in the rotations used. To the extent that the role of canola is diminished, there can be important implications for farmers and advisers who are interested in the long-term sustainability and diversity of agriculture in the region. Recognition of the change in incentives is important for all those involved. Farmers understand that enterprise choice decisions are complex, based not only on the profitability of individual enterprises but the availability of resources, such as land, labour and capital, the contributions to other enterprises, and farmers' own personal goals, objectives and perceptions about the future. Whole-farm models such as PRISM Condobolin provide some insight into these farming systems allowing farmers, researchers and extension specialists consider the implications of changing prices, introduction of new technologies or introduction of a new policy. While many of the interactions between enterprises can be partially analysed using representative whole-farm models, the resources, interactions and objectives vary between farms and farmers. It is impossible to prescribe a mixture of enterprises that is optimal for all farms. However, analyses using representative farm models having characteristics similar to farms in the Central West can provide significant insights into types of enterprise combinations likely to be adopted by farmers. By sensitivity testing some variables, such as commodity prices, we are able to determine the robustness of optimal rotations and the likely response to the introduction of a new technology or policy. Analysis such as this has enabled insights into the farming systems and their response to change. This is important as it can give farmers an indication of how their profitability might be influenced by a particular change. Comparisons using farm financial performance data may be misleading as it is difficult to isolate the influence of one variable from other important variables such as yields and machinery technology changes. This analyses is also important for researchers, extension specialists and policy makers as it enables some insight into the influence of changed market conditions on farmers profitability, rotation choice and adjustment needs. It is hoped that this insight leads to a better understanding of the influence of market signals on farmers' decisions and the potential impact on research and extension programs promoting rotational benefits of canola, pulse crops and legume based pasture. ReferencesAWB Ltd (2002) http://www.awb.com.au Faour, K.Y., Fettell, N.A., Scott, B.J., and Brennan, J.P. (1999), PRISM Condobolin : The Manual - Version 1.0, NSW Agriculture. Kingwell, R.S. and Pannell, D.J. (1987), MIDAS , a Bioeconomic Model of a Dryland Farming System, Pudoc, Wageningen. Pannell, D.J. (1997), Introduction to Practical Linear Programming , John Wiley and Sons, New York. Patton, D.A. and Mullen, J.D. (2001 ), Farming Systems in the Central West of NSW: An Economic Analysis , Economic Research Report No. 7, NSW Agriculture, Trangie. |
|
Contact the University : Disclaimer & Copyright : Privacy : Accessibility |
|
Date Created: 03 June 2005 |
The University of Melbourne ABN: 84 002 705 224 |