|
|
|
|||

Department of Agriculture and Food Systems
|
||||
|
||||
|
|
|
|||
Department of Agriculture and Food Systems
|
||||
|
||||
|
|
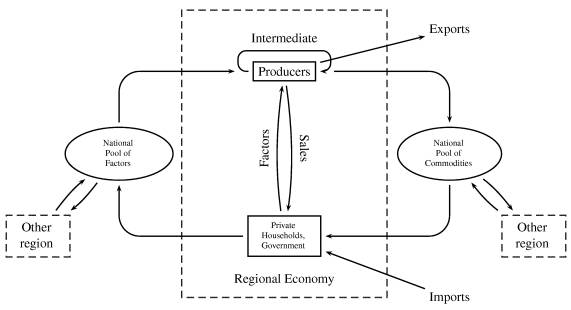
Agribusiness Review - Vol. 11 - 2003Paper 9 The Impact of China's WTO Accession on its Regional Economies * Tingsong Jiang 1 Contents CERD: A General Equilibrium Model of the Chinese Economy with Regional Dimensions . Impact of WTO Accession on China's Regional Economies AbstractAlong with the rapid economic growth since China undertook economic reform in 1978, the income gap among Chinese regions has widened. Using CERD , a computable general equilibrium model of the Chinese economy with regional details, this paper investigates the impact of China's accession to the World Trade Organisation on regional development and finds that, although all regions will gain from the accession, the trend of a widening gap among regions will be reinforced rather than eased. Specifically, the eastern coastal region gains more than the inland regions. The result is robust no matter whether the change in trade balance is left free or fixed, although the scenario with zero change in the trade balance generates a lower overall welfare gain and an even worse regional disparity. A retreat from WTO commitments in tariff cuts in agriculture reduces welfare gains, but could to some degree ameliorate the worsening inequality between rural and urban households and between coastal and inland regions. Similarly, increasing transfer payment to the inland regions could marginally improve the regional and rural-urban inequality at the cost of overall welfare gain. On the other hand, domestic market reform allowing more freely movement of factors and commodities across regions could improve the regional and rural-urban inequality and achieve higher total welfare gains. 1. IntroductionChina was admitted to the World Trade Organisation (WTO) in November 2001, after making WTO commitments which are far beyond those most member economies agreed to when they joined the WTO (Lardy 2002). The accession ended a fifteen-year long and difficult negotiation process, however, the discussion of the impact of China's accession on the domestic and world economy has only just begun. Many studies discuss the impact of China's accession using general equilibrium models because these models enable panoramic analysis of economy-wide effects. [2] These studies share the view that, overall, China will achieve gains in economic efficiency but that agriculture, the auto industry and the banking system are vulnerable sectors. Few studies have tried to investigate the impact of WTO accession on regional development. Yang and Huang (1997) and Jiang (2002a) use different types of representative households to approximate the regional impacts of trade liberalisation and WTO accession. Diao, Fan and Zhang (2002) and Diao et al (2002) present a general equilibrium model with partial disaggregation, i.e., distinguishing nine different regions only for the agricultural sectors. Fan and Zheng (2000, 2001) discuss the regional impact of trade liberalisation in their PRCGEM model following the top-down approach. However, their analysis is incomplete because it attributes the regional impact only to the difference in sectoral composition. One reason for this limitation is that constructing a multi-regional CGE model of the Chinese economy requires detailed regional input-output, income, consumption and trade data which are often difficult to obtain. Although difficulties exist, the regional impacts of WTO accession should be paid equal attention to the sectoral impacts. It is an even more important issue in the following senses. First, China is a big country with huge regional differences in geographic and economic terms, and the regional income disparity worsened along with the economic reform and growth during the 1990s. This income disparity has become so great that the central government announced the "West Development Strategy" in 2000. Second, analysis of sectoral effects is a part of the investigation into the regional effects of WTO accession, therefore a regional analysis could provide a more comprehensive picture of the effects. This paper discusses the impact of WTO accession on China's regional economies using a general equilibrium model of the Chinese economy with regional details, CERD . It is organised as follows. The next section describes the structure of the CERD model. It is followed by the description and discussion of results of model simulations of tariff cuts in line with WTO commitments. Section 4 presents the results of simulating some policies to address the regional disparity issue. Finally, some conclusions and the future direction of research are discussed. 2. CERD: A General Equilibrium Model of the Chinese Economy with Regional DimensionsThis section gives a brief introduction to the model of the Chinese economy used in the analysis. For more details about the model, see Jiang (2002b). 2.1 Overview of CERDAs CERD suggests, it is a multi-regional model of the Chinese economy. In this study a simple version of CERD is used, wherein Chinese provinces are grouped into three regions: east, central and west. [3] Traditionally, a multi-regional model follows the so-called "top-down" approach where a central model is solved and then a regional distribution is done using the shares of the different regions. For example, the PRCGEM model (Fan and Zheng 2001) classifies sectors into local and national sectors. Local sectors produce products which are not tradable between regions. Although national sectors produce tradable products, it is assumed that the same percentage change in sectoral output applies to all regions. Therefore, the differences in regions' responses to the liberalisation are purely the structural effect, i.e., coming from the difference in the composition of sectors in the regional economy. By contrast, CERD uses the "bottom-up" approach. Each region in CERD is treated as an open economy with its own agents and behavioural functions. As shown in Figure 1, agents in each region make their decisions on the demand for and supply of commodities and primary factors, and regional economies are linked through commodity and factor flows. It can be seen from the diagram that CERD mimics a global model of multiple regions like GTAP (Hertel 1997). However, it has some peculiar features. First of all, regional links in CERD are more intensive than in a global model, especially for the movement of primary factors. For example, in GTAP labour is immobile across countries, while CERD allows partial mobility across regions within China. CERD assumes perfect mobility of capital across domestic regions and sectors. Figure 1: Structure of CERD
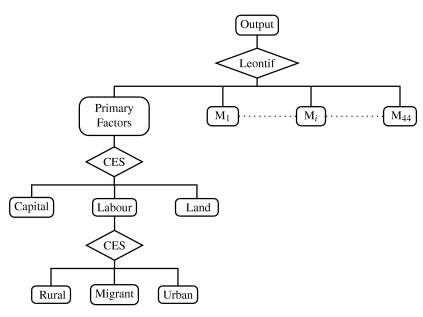
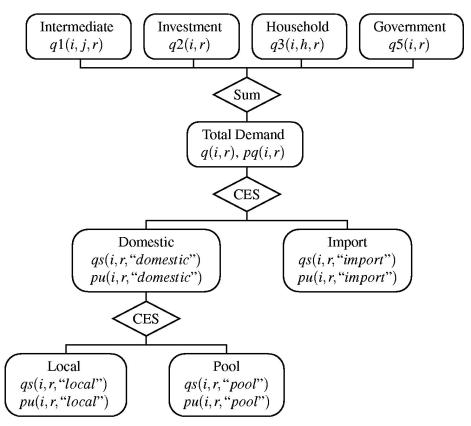
As labour and capital can move across regional boundaries, it is important to distinguish between the usage and ownership of these factors to better calculate regional household income and consumption. This makes CERD superior to some CGE models. Another feature of CERD is that rural and urban households are distinguished in each region according to their possession of primary factors. This is very important and appropriate for the analysis of the Chinese economy where rural and urban areas are still separated to some degree because of various restrictions, although significant improvements have been made. For example, the household registration system, which identifies a person as a rural or urban resident, is still in effect and prevents people from freely moving across regions, especially from the countryside to cities. Another difference between CERD and global models is its treatment of regional links. Ideally, inter-regional flows of commodities and factors would be presented in the model, however, such information is not available as there are no "customs" in each province to register "imports" from and "exports" to other provinces. In order to avoid arbitrary decisions in creating the database, CERD models inter-regional trade indirectly via a national pool of commodities and factors. Each region sells its excess supply to and buys excess demand from the national pool (Figure 2). CERD also distinguishes between regional and national governments, which allows for the analysis of transfer payments. Figure 2: Production nesting
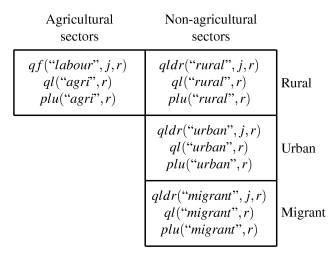
Note: Mi is intermediate input of commodity i. Finally, CERD has a fairly detailed representation of commodities. There are 44 sectors in the model, among which are 5 agricultural sectors, 25 industrial sectors, one construction sector, and 13 service sectors (see Table A.1). 2.2 Primary Factor Markets2.2.1 Demand for Primary FactorsEach sector in each region is represented by a firm producing a single commodity. Perfect competition and constant returns to scale are assumed for all firms. The production is modelled by a nest of technologies (Figure 2). At the first tier of the nest the technology is Leontif, that is, the production of a good requires fixed proportions of aggregated primary factors, or value added, and intermediate inputs. At the second tier, the value added is an aggregation of labour, capital, and land with a constant elasticity of substitution (CES). At the third tier, demand for different types of labour are determined. The labour demand by non-agricultural sectors is a CES aggregation of rural, urban and migrant labour, while agricultural sectors demand only rural labour. Therefore, there are four types of labour in the demand side: "agri" labour which is rural labour used in agricultural sectors; and "rural", "urban" and "migrant" labour which are used in non-agricultural sectors (see Figure 3). Figure 3: Demand for different types of labour
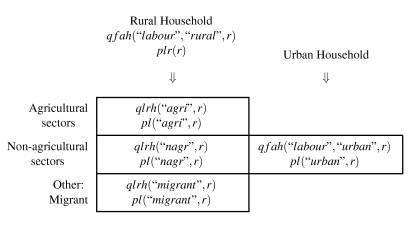
Figure 4: Supply of different types of labour
2.2.2 Supply of Primary FactorsEach household owns an endowment of primary factors, QFAH(v,h,r), and allocates the endowment to different uses according to a constant elasticity of transformation (CET) process. Labour is divided into rural and urban labour. Labour supplied by rural households can be used in all sectors in their own region as well as in other regions, i.e., as migrant labour. By contrast, labour supplied by urban households can be used only in non-agricultural sectors in their own region (Figure 4). These assumptions are made based on the fact that currently there is a huge amount of surplus labour in rural areas and that urban households are not willing to engage in agricultural activities. The supply of each type of labour is determined by the household's endowment of labour, the relative price of each type of labour, and the elasticity of transformation. It is assumed that capital is perfectly mobile across regions and sectors, and there is no difference between capital owned by rural households and that owned by urban households. Therefore, there is no specific transformation function governing the supply of capital to each sector in each region. Only a summation equation is needed to calculate the total supply of capital which will be equal to total demand set by the market-clearing condition, and capital in every region has the same price. Land is owned only by rural households. It is not mobile across regions but is partly mobile across agricultural sectors. The imperfect mobility of land reflects both natural and policy restrictions on land uses. For simplicity, it is assumed that land is not a production factor in non-agricultural sectors. The supply of land to each (agricultural) sector is determined by a CET process, depending on the household's endowment of land, the relative price of land in each sector, and the elasticity of transformation. 2.2.3 Factor Market ClearingAs shown in Figure 3, there are four types of labour on the demand side: rural labour used in agricultural sectors; and rural, urban and migrant labour used in non-agricultural sectors. There are also four types of labour on the supply side as shown in Figure 4: agricultural and non-agricultural labour supplied by rural households; labour supplied by urban households; and migrant labour supplied by rural households. The markets for the first three types of labour on each side can be cleared within one region, while migrant labour market clearing involves all regions. As illustrated in Figure 5 migrant labour in the national pool is a CES aggregation of migrant labour supplied by each region; then they are allocated to each region to meet the demand according to a CET process. Figure 5: National migrant labour market
Because capital is perfectly mobile across regions and sectors the market-clearing condition simply equates the total demand and supply. On the other hand, land is partly mobile across agricultural sectors within each region, and therefore its supply and demand should be matched for each (agricultural) sector in each region. 2.3 Commodity Markets2.3.1 Demand for CommoditiesAs shown in Figure 6, regional demand for a commodity, Q(i,r), is the sum of each firm's demand for intermediate goods, Q1(i,j,r), investment demand, Q2(i,r), and consumption demand of households and government, Q3(i,h,r) and Q5(i,r):
The total demand is a CES aggregation of demand for imported and domestically produced goods, and the latter is in turn a CES aggregation of goods produced locally, i.e., in its own region, and those from other regions (the national pool). This type of demand nesting has some advantages.
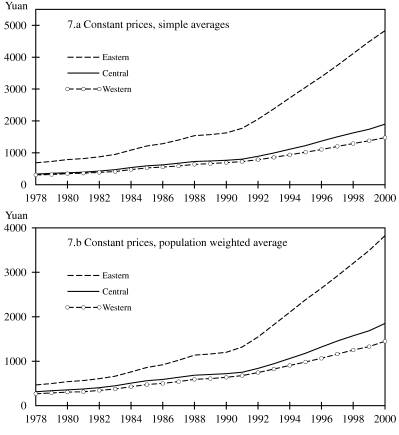
As illustrated in Figure 2 the first tier of production nest is Liontif, therefore the intermediate demand is proportional to the output level. Each private household allocates its disposable income, which is the sum of returns to primary factors net of income tax and government transfer payments, [4] into savings and consumption. Savings is a fixed proportion of disposable income, determined by the propensity to save. The remaining disposable income is for consumption. The household's consumption is modelled by a constant difference in elasticity (CDE) system. The CDE is more flexible than the CES function for modelling consumer behaviour, and is used by the GTAP model (Hertel and Tsigas 1997; Huff et al 1997). There are two levels of government: regional and central government. To simplify the treatment, it is assumed that tax collections (except import tariffs and export taxes), government saving and consumption are made by regional governments, while the central government serves only to transfer payments to regional governments. [5] Therefore, each regional government's revenue is the regional tax revenues plus transfers from the central government. The regional government's saving and consumption behaviour is similar to that of private households. First, a fixed proportion of total government revenues is saved, according to the government's propensity to save. The remaining revenues are allocated to consumption, or transferred to individual private households in the region. Once the expenditure on consumption is determined, the government's demand for individual commodities is determined according to a Cobb-Douglas utility function. Regional aggregated real investment is determined by the prices of capital returns relative to the price of investment goods, and the elasticity of investment. It is assumed that the production of this aggregate investment is a Cobb-Douglas function of individual commodities. 2.3.2 Sales of ProductsCommodities produced by firms are sold to three destinations: local (regional) markets, other regions in China, or overseas (export). The sales to each destination are modelled as a process with a constant elasticity of transformation (CET). The sales to a destination are determined by the total output of the commodity, the relative price of the commodity in each destination, and the elasticity of transformation. 2.3.3 Commodity Market ClearingThe demand for local products is met by the sales of local firms. Demand for imported commodities is supplied by the rest of the world, depending on the world market price and the elasticity of import supply. The demand for products produced in other domestic regions is met in a way similar to the migrant labour market illustrated by Figure 5. Each region's sales to other regions enter a national "pool", and then is transformed to individual regions according to a CET process. 2.4 ClosuresEndowments of primary factors are exogenous. There are labour slack variables to allow unemployment. But in the simulations described below these slack variables are set to be zero, leaving wages to adjust for full employment. [6] All tax rates including tariff rates and technological shifters are set exogenously. Exogenous tax rates imply that government revenues will change along with changes in production, income and trade after shocks. It differs from a closure where tax rates are adjusted so as to raise a fixed amount of revenues. The current closure is chosen because we want to identify the impact of WTO accession from other policy changes. The share of transfer payments from central government to regional governments does not change, i.e., payments to each region change at the same rate. The propensities to save are fixed, although they vary across households and regions. The difference between national savings and aggregate investment is the net capital inflow, which is equal to the trade deficit. There are two closures in the following simulation: no control on the trade balance and forcing the change in the trade balance to be zero. An interpretation of these two closures will be given below. 2.5 DataA particular feature of CERD is that its database has been compiled based on the provincial 44-sector input-output tables for 1997. The 44-sector classification follows the 40-sector classification in the 1997 national input-output table (National Accounts Department 1999) with the agricultural sector further disaggregated into five sectors. In total there are 28 provincial tables available. [7] These provincial input-output data have been aggregated into three regions. The eastern coastal region includes Beijing, Tianjin, Hebei, Liaoning, Shanghai, Jiangsu, Zhejiang, Fujian, Shandong, Guangdong, Guangxi and Hainan; the central region includes Shanxi, Inner Mongolia, Jilin, Heilongjiang, Anhui, Jiangxi, Henan, Hubei and Hunan; and the western region includes Chongqing, Sichuan, Guizhou, Yunnan, Shaanxi, Gansu, Ningxia, Qinghai, Tibet and Xingjiang. Other data and parameters are drawn from GTAP database 5, Yang and Huang (1997) and the China Statistics Yearbook series. 3 Impact of WTO Accession on China's Regional EconomiesChina's WTO accession document is exceptionally long. In brief, China has made a WTO-plus commitment. It promised not only to reduce significantly tariff and non-tariff barriers but also to open up sectors such as telecommunications, banking, insurance, asset management and distribution to foreign investment. It also agreed to abide by all WTO rules. Moreover, China has been forced to accept discriminatory treatment in two important rule-based areas: safeguards and antidumping (Lardy 2002). It is difficult to accommodate all of China's commitments in one simulation. Rather, this study investigates the impact of the most obvious and simplest commitment: the required tariff cut. Even this is not as easy as it may seem. China's import tariffs are often subject to exemption and reduction under special arrangements which make the effective tariff rates significantly different from the statutory rates. For example, the average statutory tariff rate was 16.4 percent in 2000, while tariff revenue accounted for only 4.03 percent of the value of imports (National Bureau of Statistics of China 2001). The database of the model represents the Chinese economy in 2000, with the average tariff rate being 16.2 percent, which is close to the statutory tariff rate. [8] The tariff rates used in this study (Table A.2) are mainly drawn from the GTAP Database 5 with some revisions based on other studies, e.g. Wang (2000), Ianchovichina and Martin (2001) and Anderson, Huang and Ianchovichina (2002). The WTO tariff rates are only approximately consistent with the actual commitments (Annex 8: Schedule CLII of Protocol on the Accession of the People's Republic of China). As introduced above, two closures are used in the simulation: · No control on the trade balance. In this closure, the nominal exchange rate is fixed, the trade balance is endogenous and foreign capital flows automatically match the balance. · No change in the trade balance. In this closure, a floating exchange rate regime is assumed so that the change in the trade balance can be exogenously fixed at zero. [9] One might think that the first closure is the more natural one, involving only tariff cuts in the simulation. However, it may still require some other policy changes to validate the closure. For example, it requires capital inflows to match the trade deficit at whatever level the model generates, implying that there is no control on foreign investment. This is clearly not the case. But as it is expected that foreign investment will increase after WTO accession (Chen 2001), and zero change seems too extreme, one would expect that the real situation lies somewhere between the two closures, although, perhaps, closer to the first one. Simulation results of the tariff cut can be found in Tables 1 to 2 and A.3 to A.5. Table 1 reports the macroeconomic effects of tariff cuts under different closures, and Table 2 reports the impact of tariff cuts on regional output, imports and exports of aggregated commodities or sectors, while the disaggregated sectoral results are reported in Tables A.3 to A.5. 3.1 No Control on the Trade BalanceIt can be seen from Table 1 that China has a net gain from the WTO accession. By cutting the tariff rates as listed in Table A.2, China's real GDP increases by 0.56 percent, utility increases by 0.86 percent, and the equivalent variation, a welfare indicator, reaches 63.69 billion yuan. Higher welfare comes from higher real incomes, thus higher real consumption and saving. But the tariff cut has an adverse impact on the trade balance and the terms of trade. China's trade balance declines by 42.55 billion yuan because imports increase more than exports, and the terms of trade decreases by 0.46 percent. This is because the tariff cut does not affect the border price (CIF). However, Chinese exports become cheaper because tariff cuts help to lower production costs. It can be seen from Tables 2 and A.3 that the impact will not be evenly distributed. The motor vehicle and other transport equipment sector is the biggest loser, with output declining by 16.37 percent. It is followed by food and tobacco processing, machinery and chemicals sectors, with output declining more than 3 percent. The impact on the agricultural sectors is not as severe as some studies have suggested. Crops output decreases by 1.2 percent and total agricultural output decreases by less than 0.1 percent. This is in line with that in Ianchovichina and Martin (2001). The smaller decline in agricultural output may be partly due to the smaller extent of the tariff cuts. It may be also partly attributed to the aggregation of agricultural sectors. If the crop sector could be disaggregated to individual crops, it may be that the output of some crops decreases significantly. Table A.3 shows that the sector which has the highest growth is the apparel sector, with a more than 14 percent increase in output. It is followed by electronics (9.93 percent), textiles (6.34 percent) and instruments and cultural and office machinery (3.95 percent). Table 1The changes in imports and exports are consistent with the changes in output. Imports of other agricultural products, food and tobacco processing, motor vehicles and other transportation equipment are more than doubled after WTO accession and crops imports increase by about 88 percent. [10] On the other hand, the increases in exports of apparel, textiles and electronics are of a smaller magnitude. In general, these changes reflect the comparative advantage and disadvantage of Chinese industries. The simulation result also shows that the eastern coastal region gains more from the WTO accession than the inland regions. The order of increase in total utility and equivalent variation is eastern, central and western. This suggests that regional income disparity will worsen after the accession, although all regions may gain. The eastern region gains most of the benefit from the expanding sectors. For example, apparel output in the eastern region increases by over 17 percent, while this sector's outputs in the central and western regions increase by only 0.3 percent and 1.5 percent, respectively (Table A.3). Similarly, textile output in the eastern region increases the most, while it decreases in the central region. The results show that the output level in the central region may decline after WTO accession, as indicated by the negative change in real GDP. This result seems surprising because it is generally perceived that the western region is the least developed region and thus it should be affected the most. However, the result may be justified in the following way. First, the western region has the cheapest labour, which helps in the development of labour-intensive sectors. Second, the western region has relatively abundant resource endowments which lead to its comparative advantage in resource-intensive products. Finally, the industrial base in the western region may not be as poor as people think. The Chinese government has made huge investments in the so-called "third line" program which brought about development in some sectors. Although the western region has a higher increase in output than the central region, its welfare gains are smaller. This is because government revenues in the western region decline after WTO accession. Therefore, private households in the region receive lower transfers from the government, although their real revenues from returns to factors increase. It is also found that WTO accession will worsen rural-urban income inequality. This is a feature common to all regions where rural households have a smaller increase in utility and welfare; which is understandable because rural households receive part of their income from agricultural sectors which decline in all regions after WTO accession. 3.2 No Change in the Trade BalanceThis closure has a similar impact on regional economies, despite some differences in the macroeconomic dimensions. The fixed exchange rate in the previous closure brings about domestic deflation, while the fixed trade balance with a floating exchange rate leads to depreciation of RMB by 5.5 percent, which in turn causes domestic inflation of 2.45 percent. In both cases, the real exchange rate increases, but in the current closure the increase is slightly greater (3.0 percent versus 2.6 percent) (Table 1). This closure has a smaller welfare gain than the previous one because it restrains the gains from trade by fixing the trade balance. Moreover, it causes an even wider welfare gap. In the previous closure, the eastern region's share in the total equivalent variation is 88 percent. In the current closure, all the gains are absorbed by the eastern region while the inland regions have a net loss. The gap between rural and urban households is also likely to widen. Urban households' share in the total household welfare gain increases from 79 percent to 86 percent (Table 1). 3.3 Why Does WTO Accession Worsen the Regional Disparity?To some, it may be surprising and unacceptable that trade liberalisation should lead to worsening regional disparity in China. However, further analysis may reveal that it is a necessary result. First, it is a natural extension to the historical trend. As shown in Figure 7, the income gap between China's coastal and inland regions has been widening since the economic reforms in 1978. Of the three regions defined above, the richest eastern coastal region experienced the fastest economic growth in the past two decades. The average per capita GDP in the eastern region increased seven-fold, while per capita GDP in the poorest western region increased by less than five times. Consequently, the gap in per capita GDP between the eastern and western regions increased from 380.6 yuan in 1978 to 3354.9 yuan in 2000 in real terms. This phenomenon has been well documented by many authors, e.g. Wu (1999), Sun (2000), Sun and Parikh (2001) and Jiang (2002a). Figure 7: Per capita GDP by region
Source: Author's construction based on data from various volumes of the China Statistical Yearbook. Second, the regional economies in China are segregated, which is embodied in both factor and commodity markets. The labour factor market segregation is evident as implied by the household registration system. The CERD model captures this feature. Because labour is not freely mobile, wage differentials between regions increase after the WTO accession, which leads to worsening regional income disparity. The model assumes perfect mobility of capital, which may not be the case in reality. However, it still captures some effects on regional disparity. Although the rate of return to capital is the same across regions, the coastal region still gains more than the inland regions as it owns a higher proportion of capital stocks. It is commonly recognised that regional protectionism prevails in China which prevents the integration of commodity markets. Because commodities are not to be freely traded between regions within China even after the WTO accession, factor price equalisation can not be achieved. The CERD model captures this effect through distinguishing regional commodity markets and assuming imperfect substitution between a commodity from different regions. Third, the technological levels are different in the three regions, which violate another underlying assumption of factor price equalisation hypothesis. The difference in technology is embodied in the database of the CERD model. The coastal region has more advanced technology than the inland regions, and, thus, accrues higher welfare gains after the WTO accession. It is argued that simulating only tariff cuts tends to underestimate the impact of trade liberalisation (Kehoe 2002). If considering the technological progress effect of the WTO accession, the regional income disparity may be even worse than that presented above. This is because the coastal region will have higher technological progress than the inland regions. This is evident as the foreign direct investment has been and will be concentrated in the coastal area. Fourth, because the regional economy is segregated, the difference in regional economic structure also results in the worsening disparity. As shown above, the coastal region has a higher proportion of most of the expanding sectors after the WTO accession, while the inland regions have a higher proportion of contracting sectors. 4 Policy SimulationsFrom the above discussion, some policy recommendations may be raised. This section presents the simulation results of three important policies: additional protection to the agricultural sector, domestic market liberalisation, and government transfer payments to inland regions. 4.1 Additional Protection to Agricultural SectorsMany studies of China's WTO accession have projected that agriculture is one of the hardest hit sectors. The simulations reported above confirm that agriculture will be hit by the WTO accession, which leads directly to the worsening regional disparities as the inland regions have a higher proportion of agricultural activities in their economic structure. Therefore the Chinese government (and academic circles) has been worrying about this issue and adopted some measures to anticipate the detrimental outcomes. [11] , [12] These measures provide additional protection to agriculture, being equivalent to smaller tariff cuts in agricultural sectors. To capture this additional protection to agriculture, the simulations presented in the previous section are revised with the tariff cuts in agricultural sectors being only half of the level in the previous section, ceteris paribus. The simulation results are reported in Tables 3 and 4. Several points are evident from these results. First, such policy actions do provide some cushioning effects to agricultural sectors. The increase in agricultural imports is smaller, falling from 47.3 percent to 15.2 percent with the closure of no control on the trade balance, and from 44.2 percent to 13.1 percent with the closure of no change in the trade balance. Consequently, agricultural output declines by only 0.03 and 0.07 percent, respectively. Second, because the central region is the major agricultural production area, this protection helps the central region achieve higher welfare (up from 3.36 billion yuan to 4.12 billion yuan) with the closure of no control on the trade balance, or lower welfare loss (from -2.28 billion yuan to -0.50 billion yuan). Third, it also helps to ease the worsening rural-urban inequality. Rural households have a higher growth in utility than in the previous scenario while urban households have a lower growth. Fourth, the negative impact on the trade balance and the terms of trade is now smaller. Finally, however, the total welfare gain is smaller than for the full tariff cuts set by the WTO agreement. The results suggest that it should be prudent to implement such a policy because the improvement in regional disparity is achieved at the cost of a smaller overall welfare gain of trade liberlisation. 4.2 Domestic Market ReformIt is often argued that China's domestic economy is not well integrated and heavy regional protection exists. One eminent example is the restriction on the movement of people. Also the use of land in many regions is controlled by governments. It is also frequently reported that local governments erect various barriers to bar products from other regions. However, there are no complete and accurate data to enable the calculation of tariff-like protection in Chinese regions. For this reason, a hypothetical scenario is constructed to investigate this issue. Specifically, a set of elasticities are chosen to imitate domestic market reforms. Elasticities of transformation or substitution usually describe the difference between two goods or factors. However, it may also reflect how easily one good or factor can be transformed or substituted into another. For example, a higher elasticity of transformation between rural and urban labour also describes the higher mobility of labour from rural to urban areas. In this sense, the domestic market reform is represented by increases in selected elasticities. These elasticities include the elasticity of transformation between agricultural, non-agricultural and migrant labour (from 0.1 to 1); the elasticity of transformation between different land uses (from 0.05 to 0.5); the elasticity of substitution between commodities produced locally and in other regions (Table 5); and the elasticity of substitution between different types of labour (from 4 to 14). Table 5: Elasticities of substitution between local and other products
With these new values, the inter-regional factor and commodity flows become more intensive. For example, in the closure of no control on the trade balance, the price of migrant labour declines by 0.18 percent when the elasticities are higher while it increases by 0.18 percent with the old elasticities. Consequently, migrant labour supply increases by 1.47 percent (previously the increase was only 0.25 percent). The migrant labour supply increases in all regions, with the western region increasing the most (1.98 percent versus 0.31 percent), followed by the central region (1.68 percent versus 0.26 percent) and the eastern region (0.83 percent versus 0.20 percent). Similar changes can be observed in respect of inter-regional trade of commodities. These results are understandable and do not need more explanation. It is more important to look at the welfare implications. The summary results are reported in Tables 6 and 7 while the detailed sectoral results are in Tables A.9-A.11. It can be seen from the table that with the new values of parameters, WTO accession leads to higher welfare gains. Total welfare gain increases from 63.69 billion yuan in the closure of no control on the trade balance and 48.04 billion yuan in the closure of no change of the trade balance to 69.04 and 56.79 billion yuan, respectively. Although the worsening of the regional income disparity is still observed, its magnitude has become smaller when factor and commodities are allowed to move more freely. Every region has a higher welfare gain than before, and the shares of inland regions in total gain increase from 12 percent to 14 percent. The increment in the rural households' utility and welfare after the WTO accession is higher with new parameters than with old ones, while the increment in the urban households' utility and welfare is now smaller, implying a smaller degree of the rural-urban inequality. 4.3 Transfer PaymentsA counterfactual transfer payment program is also simulated using the CERD model. The program simply involves 10 percent increase in the central government's transfer payment to the central and western regions, respectively. The results are reported in Tables 8, 9 and A.12-A.14. Table 7The simulation results do not give a clear justification for such a program. Although the regional and rural-urban inequality improve slightly with additional transfer payment to the inland regions, the total welfare gains decline from 63.69 and 48.04 billion yuan, respectively, to 63.09 and 47.72 billion yuan. The reduction in total welfare comes from the much sharper decline in the government utility of the eastern region. It could be argued that government spending in the eastern region has higher returns, therefore a switch from eastern to inland regions causes efficiency losses. However, one can not claim too much just based on this simulation, because the use of government spending is not specifically modelled and the transfer payment decision is not governed by an optimisation process. Table 85 ConclusionRegional income disparity in China has been worsening since the economic reform. Using a general equilibrium model of the Chinese economy with regional details, this paper finds that this trend will be reinforced rather than eased by the WTO accession. The eastern coastal region will have much higher gains than the inland regions. The two inland regions will have similar gains with the central region being only marginally better off than the western region. It is also found that the rural-urban inequality will worsen in all regions. The results are robust no matter whether the trade balance is fixed or not. However, keeping the trade balance unchanged leads to smaller overall welfare gains and a wider regional income gap than the trade balance is endogenous. Lowering the tariff cuts in agriculture reduces the total welfare gains, although it modifies the trend of worsening inequality between rural and urban households and between regions. Similarly, increasing the transfer payment to the inland regions could marginally improve the regional and rural-urban inequality at the cost of a smaller overall welfare gain. On the other hand, domestic market reform, allowing more freely movement of factors and commodities across regions, could improve the regional and rural-urban inequality and achieve higher total welfare gains. Although most of the results derived by the analysis are consistent with other studies and people's perceptions, one should be cautious in accepting these results. Firstly, this paper discusses only tariff cuts, rather than the whole picture implied by China's WTO commitments. The analysis could be extended to cover other issues, such as non-tariff barriers, tariff rate quotas (TRQs) and domestic support. For example, the baseline tariff rates of the service sector are set at zero. Clearly, in reality, this is not the case. The simulation using the closure of no control on trade balance shows that imports of crops increase by 84 to 88 percent, which implies that the tariff rate quota for some crops may be binding. So the introduction of the TRQ in the model is necessary to obtain more realistic results. Secondly, the CERD model is a national model which suppresses international linkages and may omit some important information. For example, it predicts that China's apparel sector will increase following WTO accession. However, this result is very much dependent on whether other countries initiate the special textile safeguards. Therefore, it is appropriate to link CERD with a global model to reflect these international relationships. Thirdly, the database and parameters need to be refined. For example, regional protection measures should be introduced. Also, the agricultural sectors could be disaggregated further as the present aggregation may hide significant impacts on some crops. ReferencesAnderson, Kym, Jikun Huang, and Elena Ianchovichina. 2002. "Impact of China's WTO Accession on Rural-Urban Income Inequality." Paper presented at the Australian Agricultural and Resource Economics Society Pre-Conference Workshop on WTO: Issues for Developing Countries, Canberra, 12 February 2002. Chen, Chunlei. 2001. "The Implication of China's WTO Accession for Foreign Direct Investment in China." In OECD, ed., The Implication of TIL for China's Domestic Economic Development and Policies, Paris: OECD. Diao, Xinshen, Shenggen Fan, and Xiaobo Zhang. 2002. "How China's WTO Accession Affects Rural Economy in the Less-Developed Regions: A Multi-Region, General Equilibrium Analysis." TMD Discussion Paper 87, International Food Policy Research Institute, Washington, D.C. Diao, Xinshen, Sherman Robinson, Agapi Somwaru, and Francis Tuan. 2002. "Regional and National Perspectives of China's Integration into the WTO: A Computable General Equilibrium Inquiry." Paper presented at the 5th conference on global economic analysis, Taipei, Taiwan, 5-7 June 2002. Fan, Mingtai, and Yuxin Zheng. 2000. "The Impact of China's Trade Liberalization for WTO Accession: A Computable General Equilibrium Analysis." Paper presented at the Third Annual Conference on Global Economic Analysis, June 27-30, 2000, Monash University, Australia. Available at http://www.monash.edu.au/policy/conf/42fan.pdf --. 2001. "China's Tariff Reduction and WTO Accession: A Computable General Equilibrium Analysis." In Peter Lloyd and Xiao-guang Zhang, ed., Models of the Chinese Economy, Cheltenham, UK; Northampton, MA, USA: Edward Elgar, 211-235. Francois, Joseph F., and Dean Spinanger. 2002. "Greater China's Accession to the WTO: Implication for International Trade and for Hong Kong." Paper presented at the 5th conference on global economic analysis, Taipei, Taiwan, 5-7 June 2002. Hertel, Thomas W., ed. 1997. Global Trade Analysis: Modeling and Application. Cambridge, UK; New York, USA; Melbourne, Australia: Cambridge University Press. Hertel, Thomas W., and Marinos E. Tsigas. 1997. Chapter 2: "Structure of GTAP". In Thomas W. Hertel, ed., Global Trade Analysis: Modeling and Application. Cambridge, UK; New York, USA; Melbourne, Australia: Cambridge University Press, 13-73. Huff, Karen M., Kevin Hanslow, Thomas W. Hertel, and Marinos E. Tsigas. 1997. "Chapter 4: GTAP Behavioral Parameters." In Thomas W. Hertel, ed., Global Trade Analysis: Modeling and Application. Cambridge, UK; New York, USA; Melbourne, Australia: Cambridge University Press, 124-148. Ianchovichina, Elena, and Will Martin. 2001. "Trade Liberalization in China's Accession to WTO." memo, The World Bank, Washington D.C. Jiang, Tingsong. 2002a. "WTO Accession and Regional Incomes." In Ross Garnaut and Ligang Song, ed., China 2002: WTO Entry and World Recession, Canberra: Asia Pacific Press, 45-62. --. 2002b. "The Structure of CERD: A General Equilibrium Model of Chinese Economy with Regional Dimension." memo, National Centre for Development Studies, The Australian National University, Canberra. Kehoe, Timothy J. 2002. "An Evaluation of the Performance of Applied General Equilibrium Models of the Impact of NAFTA." Keynote speech at the fifth conference on global economic analysis, Taipei, Taiwan, 5-7 June 2002. Lardy, Nicholas R. 2002. Integrating China into the Global Economy. Washington D.C.: Brookings Institution. Li, Shantong, Zhi Wang, Fan Zhai, and Lin Xu. 1998. "The Global and Domestic Impact of China Joining the World Trade Organization." Research Report, Washington Centre for China Studies and Development Research Center, the State Council, People's Republic of China. Lloyd, Peter, and Xiao-guang Zhang, eds. 2001. Models of the Chinese Economy. Cheltenham, UK; Northampton, MA, USA: Edward Elgar. National Accounts Department, National Bureau of Statistics of China. 1999. Input-Output Table of China (1997). Beijing: China Statistical Press. In Chinese. National Bureau of Statistics of China, ed. 2001. China Statistical Yearbook 2001. Beijing: China Statistics Press. in Chinese. Sun, Haishun. 2000. "Economic Growth and Regional Disparity in China." Regional Development Studies 6:43-66. Sun, Haishun, and Ashor Parikh. 2001. "Exports, Inward Foreign Direct Investment (FDI) and Regional Economic Growth in China." Regional Studies 35 (3): 187-196. Wang, Zhi. 2000. "The Economic Impact of China's WTO Accession on the World Economy." memo, Economic Research Service, U.S. Department of Agriculture, Washington D.C. Wu, Yanrui. 1999. "Income Disparity and Convergence in China's Regional Economies." Discussion Paper 99-15, Department of Economics, University of Western Australia. Available at http://www.econs.ecel.uwa.edu.au/economics/ dpapers /DP1999/9.15.pdf last accessed on 2 January 2002. Yang, Yongzheng, and Yiping Huang. 1997. "The Impact of Trade Liberalisation on Income Distribution in China." Economics Division Working Papers, China Economy 97/1, Research School of Pacific and Asian Studies, Australian National University, Canberra. Yu, Wusheng, and Søren E. Frandsen. 2002. "China's WTO Commitments in Agriculture: Does the Impact Depend on OECD Agricultural Policies." Paper presented at the 5th conference on global economic analysis, Taipei, Taiwan, 5-7 June 2002.* This research was carried out with the financial support from Australian Centre for International Agricultural Research through Project ADP/1998/128 "Achieving food security in China - implications of likely WTO accession". The author wishes to thank Prema-Chandra Athukorala, Chunlai Chen, Ron Duncan, Ross Garnaut, Yiping Huang, Tony Lawson, Hong-Giang Le, Siyang Liu, Feng Lu, Warwick McKibbin, Xin Meng, Ligang Song, Ray Trewin, Rod Tyers, Xiaolu Wang, Yongzheng Yang and two anonymous referees for their help and valuable comments. [1] Asia-Pacific School of Economics and Management, The Australian National University, Canberra 0200 tingsong.jiang@anu.edu.au and Centre for International Economics, GPO Box 2203, Canberra 2601 tjiang@thecie.com.au[2] For example, see Li et al (1998), Wang (2000), Ianchovichina and Martin (2001), Lloyd and Zhang (2001), Anderson, Huang and Ianchovichina (2002), Diao, Fan and Zhang (2002), Diao et al (2002), Francois and Spinanger (2002), and Yu and Frandsen (2002) [3] The detailed version of the CERD model identifies 28 regions, which correspond to one province, autonomous region or municipality directly under the central government in mainland China, with exceptions where Hainan, Ningxia and Tibet are included in, respectively, Guangdong, Gansu and Qinghai. [4] It should be noted that each household's income is calculated according to its possession rather than its use of primary factors. This is necessary for the accuracy of regional income calculations because of the mobility of labour and capital. It might lead, however, to some bias in the calculation because of migrant labour. Specifically, it may underestimate (overestimate) income, and thus the consumption, of regions with net inflows (outflows) of migrant labour. However, most migrant labour is seasonal, and migrants send most of their earnings back to their households. In this sense, the current approach is more accurate than that based on the use of factors. If it is found that more migrants choose to reside in their work place permanently the calculation could be adjusted by changing each household's factor endowment in the current framework. [5] If the central government was allowed to consume, in addition to the amount of goods it could consume, it should also make decisions about where the commodities are bought and sold. This would unnecessarily increase the burden of computation as this can be embodied in the decision making process of individual regional governments. [6] It should be noted that the treatment here implies no change in the employment (or unemployment) level embodied in the database.[7] Three provinces or autonomous regions, Hainan, Ningxia and Tibet, do not have input-output tables. These regions are small in economic scale and their input-output data were constructed according to information about neighbouring regions with similar natural and economic characteristics. Specifically, Hainan is included in Guangdong, Ningxia in Gansu, and Tibet in Qinghai. [8] Although this is higher than the effective rate, it may represent the actual protection level if considering non-tariff barriers. Moreover, the effective rate tends to underestimate the actual protection level as it is weighted by import volumes. [9] It could be set at any level, but zero change is an obvious target. [10] It should be noted that China's crop imports account for only about 1.3 percent of total imports in the baseline, and after the 88 percent increase crop imports are still small in absolute terms. [11] The problem of so-called San Long (agriculture, farmers and rural development) has been a popular topic. [12] For example, the newly implemented reporting requirement for genetically modified food is interpreted as an important tool to protect China's traditional soybean growing areas in the northeast region against competition from the US. However, it should be pointed out that these practices have been learnt from other countries. China often complains that its exports face even stricter technical barriers. |
|
Contact the University : Disclaimer & Copyright : Privacy : Accessibility |
|
Date Created: 03 June 2005 |
The University of Melbourne ABN: 84 002 705 224 |