|
|
|
|||

Department of Agriculture and Food Systems
|
||||
|
||||
|
|
|
|||
Department of Agriculture and Food Systems
|
||||
|
||||
|
|
Agribusiness Review - Vol. 10 - 2002Paper 3 Beef Consumption, Supply and Trade in Korea 1Jung-Sup Choi a , Zhang-Yue Zhou b and Rodney J. Cox b a - Korea Rural Economic Institute, Seoul 130-710, Korea
AbstractUntil recently the Korean beef market was heavily protected. However, since the beginning of 2001 there have been significant changes to beef import arrangements and their distribution channels, and the protection in the beef market has fallen. In January 2001 beef import quotas were lifted and replaced by an import tariff. The dual retail system - where domestic and imported beef are sold separately - was abolished in September 2001, and now domestic and imported beef can be sold in the same outlet. In addition, any retailer is now permitted to sell imported beef. Thanks to the WTO-led reforms, Australia can benefit from the changes in the Korean beef market. In this study, we examine beef consumption trends in Korea; Korea's beef cattle production and its beef supply potential; beef import prospects; likely responses in the Korean beef industry as a result of the beef import tariffication; and beef trading arrangements in Korea. We also draw implications on how the Australian beef industry may capitalise on the opening up of the Korean beef market. 1. IntroductionKorean beef production experienced some major fluctuations in the 1990s. The number of beef cattle increased from 1621 thousand head in December 1990 to a peak of 2891 thousand head in September 1996, and then started to decline. By June 2001, it had dropped to 1507 thousand head. On the other hand, the consumption of beef in Korea has been on the increase, at a rate of 8.6 per cent per annum during 1990-2000. This increase was met by increased beef imports. Beef imports grew from 82 thousand tonnes in 1990 to over 188 thousand tonnes in 2000, increasing at an annual growth rate of 8.7 per cent. Until the end of 2000 the Korean beef market was heavily protected. As a result, beef prices were high in Korea - several times higher than in Australia. However, beef market protection underwent a major change on 1 January 2001, when beef import quotas were lifted and replaced by an import tariff. In addition, the dual retail system - where domestic and imported beef are sold separately - has been regarded as inconsistent with WTO rules. As a result, since 10 September 2001, this dual system has been abolished and any retailer is now permitted to sell imported beef. As a major beef producer and exporter, Australia is significantly affected by what is happening in the Korean beef market. Australia produces approximately two million tonnes of beef per annum, of which 65 per cent is exported. The changes in the Korean beef market are likely to offer Australia with enormous business opportunities. Hence it is extremely advantageous for the Australian beef industry to explore further the Korean beef market. However, in Australia there is a dearth of published material on Korea's beef industry and market. In this paper, we examine beef consumption trends in Korea; Korea's beef cattle production and its beef supply potential; beef import prospects; likely responses in the Korean beef industry as a result of the beef import tariffication; and beef trading arrangements in Korea. 2. Beef Consumption in Korea2.1 Current StatusIn Korea, beef is a very expensive food compared to pork and chicken (see Table 1). Nonetheless, in recent years beef has become an integral part of the Korean diet. The traditional Korean diet has three components: (1) a staple food dish of rice, (2) side dishes of various vegetables, fish, and meat, and (3) a bowl of soup. At home, people eat beef as a major side dish or as beef soup. Table 1. Retail Prices of Beef, Pork and Chicken in Korea (Korean Won/kg)
Note: In 2000, 1A$=703.5 Korean Won. Beef consumption outside home is mainly in traditional Korean restaurants. Restaurant prices for beef are very expensive in Korea. In restaurants, Koreans barbecue the seasoned beef (bulgogee) or prime rib (galbee) on a grill. Although beef steaks are not used in traditional Korean dishes, they are served in some western style restaurants that have opened recently in urban areas and are enjoyed by the younger generation. A recent survey of housewives regarding their families' beef consumption, conducted by the National Agricultural Cooperatives Federation (NACF) in Seoul area during 2000, shows that some 74 per cent of respondents' families eat beef mostly at home and 14 per cent eat beef mostly at restaurants (NACF 2000). In addition, 30 per cent of the surveyed households purchase beef at least once a week and 33 per cent purchase beef once a fortnight. Forty six per cent of the surveyed households eat beef one to two times per two months at restaurants. Households with higher incomes purchase more beef. In addition, older housewives tend to purchase more beef than do younger ones. Younger housewives with a job, higher incomes, and fewer family members tend to consume more beef outside the home. The NACF survey also revealed some other interesting beef consumption details. For example, the popular beef recipes at home are beef soup (69.3%), bulgogee (34%), and barbecue (29.5%) [multiple choices]. In contrast, the favourite beef dishes at restaurants are barbecue (72.8%) and bulgogee (32.3%). Some 73 per cent of the surveyed households regard the quality of beef as more important than the price of beef, with 84 per cent preferring domestic Hanwoo beef to imported beef. Hanwoo beef is believed to be more suitable for Koreans' tastes 2 . More than half of the surveyed households prefer Hanwoo beef for cooking soup, for presenting as a gift to others, or as a treat for guests at home. For bulgogee and barbecue, there is little difference to Koreans between domestic Hanwoo and imported beef. Coupled with the rapid economic development and improved consumer income in Korea in the past three decades, Koreans' beef consumption has increased steadily (see Table 2). Per capita beef consumption increased from 1.2 kg in 1970 to 8.5 kg in 2000, at an annual growth rate of 6.8 per cent. Total national beef consumption increased from 37 thousand tonnes to 402 thousand tonnes during the same time period (at an annual growth rate of 8.2 per cent). Out of the 402 thousand tonnes total beef consumption in 2000, 214 thousand tonnes were domestically produced and 188 thousand tonnes were imported. 2.2 TrendsPork, beef and chicken are the major meat items consumed in Korea. Per capita annual consumption of pork, beef and chicken was 16.5 kg, 8.5 kg, and 6.9 kg, respectively, in 2000. Although pork has the highest per capita consumption at present, its rate of increase in consumption has slowed down in the past decade. On the other hand, the increase in beef consumption has been the fastest (see Table 3). During 1970-2000, the annual growth rate of beef consumption at both the national total and per capita levels was the highest of all the meats. In the past decade, while the growth rate in consumption of other meats has slowed down, the growth rate of beef consumption has increased, and is much higher than the rates of any other meat (Table 3). Table 2. Beef Consumption in Korea, 1970-2000
Source: NACF, Materials on Price, Supply and Demand of Livestock Products, various issues. Table 3. Major Meat Consumption in Korea, 1970-2000
Note: Beef consumption growth rates for 1970-2000 are slightly different from those in Table 2 due to rounding errors. Source: MAF 2001b, Major Statistics of Agriculture and Forestry 2001, pp. 316-317. According to a study by Choi and Lee for the time period of 1976-1998 (2000), families with more highly educated parents tend to prefer beef to pork and chicken. The authors did not describe any relationship between education and income, but it would be reasonable to assume that more educated people have more earnings. This result is thus consistent with the findings by NACF (2000) that families with higher incomes consume more beef. More income elastic than other meats, beef in Korea has an income elasticity estimated at 1.26, while elasticities of pork and chicken are 0.38 and 0.27, respectively (Choi and Lee 2000). Koreans' income has increased rapidly in the past three decades. The per capita GNI (Gross National Income) has increased from less than 100 thousand Korean Won in 1970 to 10890 thousand Won in 2000, in nominal terms. There was a drop in the per capita GNI in 1998 due to the 1997 financial crisis, but this was soon arrested and the per capita GNI increased in 1999, to a level higher than in1997. During the past decade, the per capita GNI has been increasing at an annual growth rate of 10 per cent, from 4140 thousand Won in 1990 to 10890 thousand Won in 2000. The Korean economy is expected to grow at a rate of 4-5 per cent per annum in the years to come and hence consumers' income will be expected to increase. Given that the demand for beef is more income elastic and that there is a strong tendency towards westernisation of food consumption (MAF n.d.), it is expected that beef consumption, and thus the demand for beef, will increase. A recent projection by the Ministry of Agriculture and Forestry provides further support, estimating that the annual per capita consumption of beef will increase to 10.6 kg in 2010 from 8.5 kg in 2000. Total beef consumption will increase faster because of population increase and will reach 536 thousand tonnes by 2010 (see Table 4). Table 4. Projections of Beef Consumption in Korea, 2001-2010
Note: The MAF report did not specify assumptions and methods used for the projections. Source: MAF 2001a, 'A comprehensive development program for Hanwoo industry'. The above discussion clearly shows that the changes in Koreans' tastes and preferences in food consumption, combined with a continued increase in consumers' income, are likely to increase future demand for beef. In the next section we address beef supply issues in Korea. 3. Beef Supply in KoreaSupply to the Korean beef market comes from domestic production and imports. Domestic beef supply comes from Hanwoo (the local cattle breed), dairy cows and steers, and cross-breeds. In 2000, of the total slaughtered cattle of 997331, Hanwoo accounted for 816895 (81.9%), dairy cows 165117 (16.6%), dairy steers 10210 (1.0%), and cross-breeds 5109 (0.5%). In this section, we examine: (1) Korea's beef production development, production patterns and potential, (2) beef imports, and (3) the prospects for beef imports. 3.1 Beef Production in Korea3.1.1 Beef industry development Historically, beef cattle were raised on farms for draught use, mainly for cultivating land and pulling carts. Hence, beef was a by-product. With increased agricultural mechanisation and increasing demand for beef, farmers started feeding cattle for beef production. This resulted in demand for a huge amount of cattle feed. The Korean agricultural sector was not able to produce enough feed, due to the need to produce other agricultural products. As a result, Korea depends almost 100 per cent on imported cattle feed, specially feedgrain and hay. The number of beef cattle has been fluctuating (see Figure 1), primarily influenced by cattle prices and some other factors such as live cattle imports during 1978 to 1984 and various government programs. During the past three decades, there have been a number of major downturns and peaks. The major downturns took place in 1981 and 1989, while the major peaks happened in 1974, 1985 and 1996. The largest number of cattle was reported in 1996 at 2844 thousand. On 1 June 2001 the cattle herd number was at a low level of 1507 thousand. Figure 1. Number of Head of Beef Cattle in Korea, 1970-2000
Source: NACF, Materials on Price, Supply and Demand of Livestock Products 2001, p.150. Korea's total cattle number has been influenced by government programs. For example, under the "Future Farmers' Loan" program initiated in 1980, many eligible young farmers chose to specialise in raising cattle. As a result, the number of beef cattle increased significantly in 1985 (see Figure 1). Other major programs designed by the government to encourage domestic beef production include: 3 Payment scheme for calf production promotion;
Despite such government programs that attempt to promote domestic beef production, the number of cattle has been decreasing since 1996. One reason for this decrease was the outbreak of BSE (Bovine Spongiform Encephalopathy) in England in 1996. Due to the fear of BSE, demand for beef dropped quickly and cattle prices started to go down in 1996. On the other hand, a key factor was farmers' fear of a weaker domestic beef sector resulting from the incoming beef trade liberalisation. Expecting an influx of imported beef into Korea, farmers have responded by reducing the number of cattle or leaving the industry. As shown in Figure 1, the number of cattle was at a low level of 1507 thousand in early June 2001. In the meantime, the number of cows with reproductive capacity also started to decrease from 1996. After reaching a record high of 1225 thousand cows in 1996, the number declined to 651 thousand by 1 June 2001 (Yoo 2000). The number of cattle farms reached a peak of 1358 thousand in 1974 but has been declining since then (Figure 2). It was 989 thousand in 1980, 620 thousand in 1990, and 364 thousand in 1999. Correspondingly, the proportion of cattle farms out of the total farms also decreased significantly. This proportion was 44.3 per cent in 1970 and slightly increased to 45.9 per cent in 1980. It then decreased to 35.1 per cent in 1990 and 26.3 per cent in 1999. A recent survey shows that the number of cattle farms has further dropped to a mere 273 thousand by 1 June 2001, from 364 thousand in 1999 (MAF 2001, Livestock Statistics). Dairy cows account for about 17 per cent of total beef supply from domestic sources in Korea. The number is relatively stable, at about 550 thousand during the last decade. The number of dairy farms has also decreased, with a recent survey reporting that there were 13 thousand dairy farms and 544 thousand dairy cattle on 1 June 2001. Average size per farm was 41.8 head (MAF 2001, Livestock Statistics). Figure 2. Number of Cattle Farms and Farms with Less than 10 Head, 1970-2000
Source: MAF, Livestock Statistics, various issues. It seems the Korean beef industry is facing a tremendous challenge following the tariff-only beef trade liberalisation that started on 1 January 2001. The impacts of market liberalisation have been clearly felt through the reduction in the number of cattle head and the number of cattle farms. 3.1.2 Current production pattern There are two types of cattle farms in Korea: calf production (cow-calf) and beef cattle feeding (feeding). Cow-calf farms are mostly small-scale farms, with less than 30 cows. Feeding operations usually have 30 or more cattle, sometimes reaching about 500 head. Farmers sometimes feed dairy bull-calves or hybrid calves, but the number is small and no longer differentiated in the statistics. Farms with 20 to 30 head sometimes switch between cow-calf operation and feeding depending on the relative income from each operation. Average cattle herd size per farm is extremely small in Korea. It has doubled from 1.2 head in 1970 to 2.0 head in 1983. It reached 3.0 head in 1991, 4.0 head in 1993, and 5.6 head in 1999. The majority of cattle farms are small-scale, operating beef cattle as family side-line businesses. Small-scale farms are predominantly cow-calf farms. Until 1984, the proportion of cattle farms with less than ten head was 99 per cent. Recently, it reduced to a little over 88 per cent. There have been some changes in the size distribution. The proportion of farms with 50 head of cattle or more is on the increase. The number of small-scale farms with less than 30 head is declining very fast, dropping from 614800 farms in 1990 to 288500 in 2000, a decrease of 53.1 per cent. With the scheduled beef market liberalisation, many small-scale, cow-calf farms left the beef industry, the majority switching to other farming activities and a few moving to urban areas. Cattle farmers did not envisage a bright future for the domestic beef industry in terms of prices and profitability. When cow-calf farms decide to exit the industry, they usually sell cows after fattening, thus causing a decline in mature cow numbers. Table 5 shows a rapid decrease in cattle farms as well as the number of cattle during 1998 to 2001. Most of the decrease took place in the group with less than 50 head. According to Table 5, the number of cattle farms with 100 or more cattle remains unchanged in 2001 compared to 1998. However, the number of cattle raised by this group of farms has actually increased. At the same time, the total number of cattle has dropped from 2383 thousand in December 1998 to 1507 thousand in June 2001 and the number of cattle raised by the other two groups of farms has declined. This may reflect a tendency for Korean beef producers to try to increase their economic efficiency by increasing herd size as a means of staying viable in the industry. Table 5. Changes in the Number of Cattle Farms and Cattle Herd by Size
Source: MAF, Livestock Statistics. Beef production is highly dispersed throughout Korea. All large districts and provinces have cattle. According to a recent survey, the southeast Kyongbuk province has the largest number of cattle (304 thousand or 20 per cent of the national total), followed by Chungnam (Midwest) and Chonnam (Southwest) (218 thousand head each). Cheju province has the highest number of head per farm, 21.5, followed by Kyonggi, 14.1. Kyongnam has the lowest number of head per farm, 4.1 (see Table 6). Table 6. Beef Cattle Herd Distribution by Province, June2001
Source: MAF, Livestock Statistics, 1 June, 2001. In general, cattle farming businesses in Korea are not very profitable. Neither the cow-calf operation (breeding) nor the cattle feeding operation (fattening) can always cover its costs. During 1980-2000, cow-calf farms experienced a loss in 11 out of 21 years, and cattle fattening farms experienced a loss in 9 years during the same time period (NAQS 2001, p. 79). Cattle production costs and selling prices for cattle fattening farms during 1980-2000 are shown in Figure 3. Figure 3. Cattle Production Costs and Selling Prices for Cattle Fattening Farms, 1980-2000
Source: NAQS 2001, Livestock Production Costs 2000, p. 79. 3.1.3 Beef production potential The potential for Korea to substantially increase its beef production does not seem to be great. With the opening up of the beef market in early 2001, imported beef has caused a strong downward pressure on the prices of domestically produced beef. Fearing a weaker domestic beef sector resulting from beef trade liberalisation, many farmers are unlikely to invest significantly in the beef industry to improve its productivity. Indeed, as shown in the previous sections, expecting an influx of imported beef into Korea, farmers have responded by reducing the number of cattle or leaving the industry. Both the number of cattle and the number of cattle farms have declined significantly in the past decade, particularly in the late 1990s. Further, cow slaughterings have increased substantially in the past few years. Table 7 shows that about 80 per cent of beef cattle producers are 50 years old or over. These producers have few alternative employment opportunities. Clearly, the beef industry has failed to attract young people to enter. In 2000, less than 5 per cent of the producers were under 40 years of age. When the elderly producers eventually exit the industry, in most cases it is unlikely that their children will succeed them in beef production. Table 7. Age Distribution of Beef Cattle Farm Operators (2000 Census)
Source: Korea National Statistical Office 2000, 2000 Agricultural Census Report, Seoul, Korea. Another factor limiting the output of domestically produced beef is Korea's heavy dependence on imported feedgrains. International prices of feedgrains are often unstable and cause great uncertainty and concern to cattle farmers. Further, increased domestic beef production is also likely to be constrained by environmental considerations. With smaller cattle farms leaving the industry, the remaining farms tend to become larger. Consequently, the cost of handling wastes may increase significantly. Being aware of the limited ability to compete in price with imported beef, Korean beef producers, who are currently not yet politically influential, have realised that improvement in quality and the production of differentiated products (through branding) can be very important. In the past few years, they have been preparing to position themselves to compete with imported beef in the areas of quality and product differentiation. Many achieve this by forming farmers' cattle cooperatives. Currently, there are 86 such 'brand name beef cooperatives' in Korea (Nongmin-shinmun 2001), each producing and marketing its own branded beef products. 4 As a result, the proportion of first grade beef is increasing (see Table 8). However, this does not seem to have contributed to increasing the total beef production of the country. Table 8. Beef Production and Change in the Proportion of Beef Quality Grades (1993-2000)
* 1 is the highest quality grade. Quality grading is evaluated by licensed inspectors with the Animal Products Grading Service. Grading is based on marbling, colour, fabrication, and maturity. Source: NACF, Materials on Price, Supply and Demand of Livestock Products, various issues; Animal Products Grading Service 2001, Animal Products Grading Report 2000, pp. 187-202. With the beef market opening up, the Korean government could no longer use certain trade restrictions to protect its domestic beef industry. Nonetheless, some non-market measures such as direct payments, disease management, and subsidies for environmental facilities may be used to provide some indirect support to beef producers. Even with some of these supports, Korea's potential to increase beef production is still very limited. MAF has projected that both the number of cattle and beef output will decline further before the trend is reversed (Table 9). The total production, however, is unlikely to surpass its record level any more (in 1998, total domestic beef production reached a record high of 260 thousand tonnes). According to the same projection, the self-sufficiency rate will be about 36 per cent in 2010, slightly higher than that in 2005 but much lower than that in 2000 (53%). Table 9. Projections of Beef Production in Korea, 2001-2010
Note: The MAF report did not specify assumptions and methods used for the projections. Source: MAF 2001a, 'A comprehensive development program for Hanwoo industry'. According to the above discussion, it is clear that Korea is unlikely to be able to substantially increase its beef production in the future 5 . Beef self-sufficient rate will be lower compared to its current level. Beef import will be unavoidable and will continue to increase. 3.2 Beef ImportsKorea's beef supply has been in deficit in the past few decades. Beef imports to Korea began in 1976 and have since become an essential source of beef supply to the Korean market (Figure 4). In 2000, Korea imported 188134 tonnes of beef which accounted for 47 per cent of total beef supply. In 1996, imported beef supplied 149204 tonnes or 46 per cent of the Korean beef market. As a consequence of the financial crisis in 1997, imports declined in 1998 due to high costs of imports and low household incomes. Beef consumption resumed its increasing trend in 1999, with beef imports increasing in 1999 and continuing to increase in 2000. However, with the tariffication of beef trade starting from the beginning of 2001, beef imports to Korea have not increased as some might have expected. In fact, beef imports for the first half of 2001 had reduced by 42 per cent compared to the same period in 2000. A number of reasons are responsible for this. To prepare for the beef trade opening up, the government accumulated beef stocks (50000 tonnes on 1 January 2001) to curb any undue large quantity of imports. The animal disease outbreaks, BSE in EU and FMD in many parts of the world in early 2001, affected the Korean beef consumption significantly. Slow economy and weak currency were additional factors for the reduced imports. Figure 4. Beef Supply in Korea: Domestic Production and Imports, 1970-2000
Source: NACF, Materials on Price, Supply and Demand of Livestock Products 2001, p. 102. By August 2001, government beef stocks had reduced to 20000 tonnes from 50000 tonnes on 1 January 2001. The demand for beef is also recovering from public concerns about BSE and FMD in early 2001. Thus, it has been anticipated that beef imports to Korea would start to increase from late 2001 (Lugsdin 2001). It is also projected that Australian exports of beef to Korea will continue to increase over the medium term (Penm et al. 2001). Major beef suppliers to the Korean market are USA, Canada, Australia, and New Zealand. In terms of volume, the largest share was held by Australia until 1992, but since 1993 this has been held by USA (see Figure 5). This increase in the USA share is primarily attributable to two major factors: (1) US beef is regarded by the Koreans as better quality, and it is grain fed whereas Australia's is grass fed; and (2) the USA supplies specific cuts of beef that Korean importers request whereas Australia exports full sets to the Korean market. Only a small portion of Australia's beef production is consumed domestically, making it less feasible to export some specific cuts to the overseas market; the USA, on the other hand, consumes the majority of its beef production domestically. Among the suppliers to the Korean beef market, USA and Canada receive higher unit beef prices than do Australia and New Zealand (Table 10). Higher priced beef is mostly grain-fed beef and lower priced beef is known to be grass-fed. For several years, starting in 1985, the Korean government banned beef imports because domestic beef prices had plunged with a surge in supply. In 1989, USA, Australia, and New Zealand filed a complaint to GATT regarding the ban. Following the conclusion of the GATT panel on the disputes, there was a series of bilateral negotiations on how to implement the panel's conclusions. As a result, Korea set up a beef import quota of 186 thousand tonnes for a three-year period from 1990 to 1992 (the actual imports, however, were 334 thousand tonnes for this time period; see Table 2). At the same time, the 'simultaneous-buy-sell' (SBS) system was introduced to allow direct bidding between foreign suppliers and domestic buyers for an agreed portion of the annual quota. The percentage of beef imported under the SBS system was agreed to be at 7 per cent during 1990 to 1992. With subsequent negotiations, the beef import quota was increased and the proportion of SBS trade was also increased up to 30 per cent in 1995. Figure 5. Changes in Korean Beef Market Share among Major Exporters, 1990-2000
Sources: 1990-1997 personal communications with Livestock Products Marketing Corporation (LPMO); 1998-2000 Korea Meat Trade Association ( http://kmta.or.kr/kmta.html ). Table 10. Unit Import Prices by Origin (US$/kg)
* January to August Source: 1998-2000 Korea Meat Trade Association (http://kmta.or.kr/kmta.html); 1990-1997 personal communications with Livestock Products Marketing Corporation (LPMO). Following the conclusion of the GATT Uruguay Round in late 1993, three changes were brought to Korea's beef trading: (1) Korea's annual beef import quota was to be increased, (2) the tariff rate and mark-up level was to be gradually scaled down, and (3) the proportion of SBS trade was to be increased up to 70 per cent of the total annual quota by 2000 (Table 11). 6 Actual imports equalled or exceeded the quota in most years but were below the quota in the years following the financial difficulties in 1997. On 1 January 2001, the beef import quota, the SBS, and the mark-up system were all abolished. Beef can now be imported to Korea with a tariff only, at a rate of 41.2 per cent. This rate is scheduled to decline to 40.8 in 2002, then 40.4 in 2003 and 40 in 2004. Further reductions are subject to the on-going DDA (Doha Development Agenda) negotiations. Table 11. Tariff, Quota, and Imports of Beef, 1994-2001
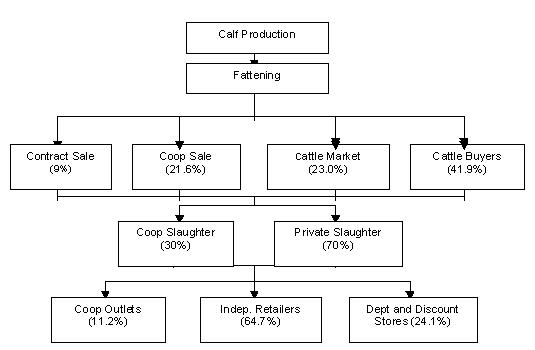
Note: n.a. is 'not applicable'. Mark-up is a levy charged to imported price in order to cover the gap between domestic and world price. The mark-up was agreed between Korea and major beef exporters including the USA and Australia during the Uruguay Round of GATT negotiations. The base for mark-up was calculated by (c.i.f. import price + tariff) ´ mark-up rate. The proceeds from the mark-up went to the "Livestock Development Fund", a fund operated by the national livestock cooperative. Sources: Tariff rate, mark-up and quota: Livestock Bureau 2000, Livestock Handbook, p. 95. Imports data (total, LPMO, SBS): personal communications with agents in the Livestock Products Marketing Corporation (LPMO). 3.3 Prospects of Beef ImportsThe tariffication of beef trade will have a significant impact on the Korean beef industry and market. The Korean government has responded to the opening up of the beef market by devising non-market measures such as direct payments, disease management, and subsidies for environmental facilities in order to encourage domestic beef production. However, producers have largely responded to the market opening up by moving out of the beef industry or shifting to the production of better quality beef. In the past three years, beef production has shown a clear declining trend (Table 2). While government's non-market supporting measures may help to curtail or reverse this trend to some extent, overall, there will still be a significant gap between beef demand and supply as projected by the government (Table 9). At best, the self-sufficiency rate can be optimistically projected to be at 36.3 per cent by 2010, when the consumption will be 536 thousand tonnes while the total production will only be 195 thousand tonnes. As a whole, Koreans tend to prefer domestically produced beef to imports if they are sold at the same prices. With the removal of the dual retail system, domestic and imported beef are no longer sold separately. This gives the consumers the opportunity to compare the quality and the price of the imported and domestically produced beef. Assuming quality difference is minimal, ultimately, price may become the major determining factor that influences consumers' decision in buying imported or domestically produced beef. A study of the cross price elasticity between domestic and imported beef tends to suggest that, for the same percentage price increase, an increase in domestic beef price will result in a larger demand for imported beef (Choi and Lee 2000, p. 84). According to the findings by Choi and Lee, the cross price elasticity between domestic and imported beef is 0.57; that is, a 10 per cent increase in the price of domestic beef results in a 5.7 per cent increase in imported beef consumption. However, the cross price elasticity between imported and domestic beef is only 0.23; that is, a 10 per cent increase in imported beef price only results in a 2.3 per cent increase in domestic beef consumption. Major beef exporting countries, such as the USA, Australia and New Zealand, continuously place pressure on Korea for more favourable terms to export their beef to Korea. If there are further cuts in import tariffs, imported beef will become cheaper compared to domestically produced beef. This is likely to encourage Korean consumers to buy more imported beef. All the above discussion clearly indicates that, if there is no major worldwide or regional economic and trade turmoil, there will be significant and increased beef imports to Korea. Conservatively, such imports could be in the range of 320-340 thousand tonnes by the late 2010s, according to Table 9. 4. Beef Trading Arrangements in Korea4.1 Supply Chains of Domestically-produced BeefDomestic beef supply chains are composed of two stages: cattle marketing and slaughtering, and beef retailing. Cattle are sold with a direct contract, through cooperatives or private handlers. Most brand name beef is supplied through direct contract with large-scale retailers. Private handlers purchase cattle either from major cattle markets or on farms. Cattle procured by the cooperatives or by private handlers are then delivered to slaughterers (Figure 6). There are about 140 slaughterers in Korea, of whom 12 are licensed by local governments as wholesale markets. The slaughterer-wholesaler sets the price of carcasses through an open tender among designated wholesale agents. Beef is graded by inspectors at all slaughterers. There is an over-capacity of slaughtering. Most slaughterers are small in scale and operate in traditional ways. Recently the government started to administer an approval of the HACCP-based (Hazard Analysis Critical Control Point) slaughterers. As of 20 August 2001, there were 20 slaughterers approved as operating under the HACCP principles and of these nine are beef cattle slaughterers. Figure 6. Supply Chains of Domestic Beef, 1999
At the second stage of the beef supply chains, about 11 per cent of beef is retailed through cooperative outlets, 65 per cent through independent retailers, and 24 per cent through department stores and discount stores (Figure 6). The proportion of beef sold through department and discount stores is on the rise. As mentioned earlier, there are 86 'brand name beef cooperatives'. They market their beef at their own shops (30%) or through department stores or large-scale discount stores (28%). Sometimes they sell cattle to the middle-man at the farm gate (30%), to packers (7%), or to the middle-man at the cattle market (6%). Most brand name cooperatives have difficulties in securing stable outlets for their branded beef. Their small scale also prevents them from marketing their products nation-wide. Beef prices tend to fluctuate over years (Table 12). In 2000, the farm gate, wholesale and retail prices were 5504 Won/kg, 7414 Won/kg and 17418 Won/kg, respectively. Table 12. Beef Prices in Korea, 1977-2000
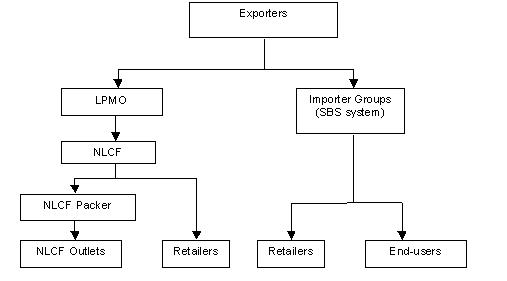
Source: National Agricultural Cooperatives Federation, Materials on Price, Supply and Demand of Livestock Products, various issues. 4.2 Marketing Arrangements for Imported BeefBeef under quota was imported and supplied to the Korean market through two major chains: the state trading agency known as the LPMO (Livestock Products Marketing Organisation), and the private sector through the SBS system (see Figure 7). Figure 7. Supply Chains of Imported Beef, before 1 January 2001
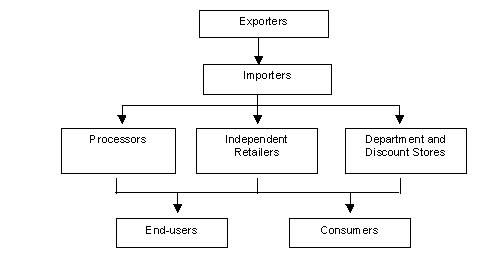
The LPMO, as a state trading agency, imported beef for price control in the domestic market. Beef imported by the LPMO was marketed through outlets of the NLCF (National Livestock Cooperatives Federation). Some beef packed by NLCF was sold at the retailers designated as import beef sellers. There were about 5000 import beef sellers. The private sector imported beef through the SBS system. The licensed importing groups (so-called "super group") included, for example, NLCF, Korea Superchain Store Association, Korea Tourist Hotel Supply Centre, and Korea Cold Storage Co. Ltd. The super groups are usually associations representing their end-users. Beef imported through the LPMO could be purchased under an open tender system. Anyone can buy the imported beef from LPMO through NLCF and then re-sell it to end users (The SBS system has been abolished following the beef trade liberalisation). Import prices under the SBS system were negotiated between exporters and the super groups. With the removal of beef import quotas on 1 January 2001, importers can directly contact exporters (Figure 8). Now tariff is the only restriction to beef import. In addition, with the WTO panel's conclusion against Korea's dual retail system, all retailing butchers will be able to sell imported beef. From September 2001, over 40000 butchers, in addition to about another 5000 exclusively designated as imported beef sellers, are eligible to sell imported beef. Furthermore, imported beef can now also be sold in the same outlets as domestic beef. Figure 8. Supply Chains of Imported Beef, after 1 January 2001
5. Summary and Concluding CommentsIn this study, we examined the current status of beef consumption and its trends in Korea; Korea's beef production and supply potential; beef import prospects; responses in the Korean beef industry to beef market liberalisation; and beef trading arrangements in Korea. In recent years, beef has become an integral part of the Korean diet and Koreans' beef consumption has increased steadily. While the growth rate of consumption of other major meats (pork and chicken) has slowed down, the growth rate of beef consumption has increased. With increasing consumer income and a further tendency towards western style food, beef consumption and thus the demand for beef in Korea are expected to increase. In spite of the strong demand for beef, the potential for Korea to substantially increase its beef production does not seem to be considerable. The Korean beef industry has been facing a tremendous challenge in the past years due to the pressure for liberalisation of the beef trade. Fearing an influx of cheaper imported beef into Korea and subsequently a weaker domestic beef sector, producers have responded to liberalisation by reducing the number of cattle or leaving the industry. Being aware of limitations in price competition with imported beef, some producers have formed cooperatives to produce quality beef and differentiated beef products (through branding). However, this does not contribute to increasing the total beef production of the country. With the beef market opening up, the Korean government could no longer use non-tariff trade restrictions to protect its domestic beef industry. The government has responded by increasingly using some non-market measures such as direct payments, disease management, and subsidies for environmental facilities. Even with these supports, however, Korea's potential to increase beef production is still very limited. It is projected that Korea's beef self-sufficiency rate will become lower compared to the current level. Hence beef imports are expected to increase. The removal of the dual retail system has allowed imported and domestic beef to be sold in the same retail outlet, and any retailer is now allowed to sell imported beef. These changes in beef marketing arrangements will further contribute to the increase in beef imports. Conservatively, beef imports are expected to increase from 188 thousand tonnes in 2000 to 325 thousand tonnes by 2005. The changes in the Korean beef market will provide major beef exporters such as Australia with greater export potential. Australia is the largest exporter of disease-free beef in the world. It also has well-established production and feedlot systems to respond to any major changes in the international beef market. It will be most advantageous for Australia to capitalise on these competitive strengths to increase its share in the Korean market. Currently the Australian dollar is low and this further lends a competitive advantage to Australian beef exports. To realise the maximum potential of beef exports to the Korean market, it is imperative for the Australian beef industry to form a longer-term business strategy to trade with Korea. The establishment of a sustainable partner relationship with Korean counterparts is very important and will benefit the Australian beef industry immensely. As a means of establishing good relationships, the Australian beef industry could consider providing the Korean beef industry with technical assistance in quality assurance. Such assistance, properly implemented, would also ensure that Australian beef will be handled and retailed in the Korean market in a manner that assures its quality, thus projecting a good image of Australian beef in the minds of Korean consumers. Currently, there has been little foreign investment in the beef processing sector in Korea. It will be beneficial for the Australian beef industry to look into its potential and the possibility of investing in this sector. The Australian beef industry needs to form long-term alliances with leading beef distributors both within Australia and in Korea. Such alliances in Korea will facilitate the Australian beef industry to identify, in a timely way, any changes in the needs of the markets. Similar alliances in Australia will help the industry to respond rapidly to changes identified in the Korean market. The opening up of the Korean beef market will provide greater export potential not only to Australia but also to any other beef exporters. Hence, the competition in the Korean beef market between those exporters will be tense. It is important for the Australian beef industry to keep abreast of developments in the Korean beef market as well as activities of the major competitors. As a result of several beef trade liberalisation measures introduced since 2001, changes have taken place and will continue to take place in the supply chains of imported beef, an area in which further investigation is warranted and should be rewarding to the Australian beef industry. ReferencesAnimal Products Grading Service (2001), Animal Products Grading Report 2000, Animal Products Grading Service, National Agricultural Cooperatives Federation, Seoul. Choi, J.H. and Lee, G.I. (2000), 'Meat demand situation and prospects of consumption', paper presented at the annual meeting of Korea Livestock Management Association, September 23. Korea Meat Trade Association (KMTA) ( http://kmta.or.kr/kmta.html ). Korea National Statistical Office (2000), 2000 Agricultural Census Report, Seoul, Korea. Livestock Bureau (2000), Livestock Handbook, Ministry of Agriculture and Forestry, Government of the Republic of Korea, Seoul , p. 95. Lugsdin, A. (2001), 'Beef market potential in Korea', presentation by MLA representative at the "Understanding the Korean Beef Market" forum, the University of Sydney - Orange, 15 August. MAF (Ministry of Agriculture and Forestry) (n.d.), 'Westernisation of food consumption pattern', Government of the Republic of Korea, Seoul . http://www.maf.go.kr/english/maf_2000.asp accessed on 23 September 2001. MAF (2001a), 'A comprehensive development program for Hanwoo industry', Government of the Republic of Korea, Seoul. MAF (2001b), Major Statistics of Agriculture and Forestry 2001, Government of the Republic of Korea, Seoul. MAF, Livestock Statistics, various issues, Government of the Republic of Korea, Seoul. NACF (National Agricultural Cooperatives Federation) (2000), 'A Survey on Consumers' Purchasing of Beef', Research Report, Research Bureau, National Agricultural Cooperatives Federation, Seoul. NACF, Materials on Price, Supply and Demand of Livestock Products, various issues, Livestock Bureau, National Agricultural Cooperatives Federation, Seoul. NAQS (National Agricultural Products Quality Management Service) (2001), Livestock Production Costs 2000, National Agricultural Products Quality Management Service, Ministry of Agriculture and Forestry, Seoul. Nongmin-shinmun ('Farmers' Daily') (2001), 'There are 86 brand named Korean beef producers', Farmers' Daily, May 29, p. 3. Penm, J. Gleeson, T. Turner, S. Fisher, B.S. (2001), 'Prospects of Australian agricultural exports to Korea', paper presented to the Third Conference of the Australian Centre for Korea Studies, Griffith University, on Australia-Korea Economic Cooperation in the 21st Century, Brisbane, 20-21 September 2001, ABARE conference paper 2001.24. Yoo, C.H. (2000), 'Liberalisation of beef market and prospects of the Korean beef cattle sector', Journal of Rural Development, Vol. 23. No. 2, pp. 183-208. Footnotes1 - This project was sponsored by the Australia-Korea Foundation. The research was undertaken primarily at the Asian Agribusiness Research Centre of the University of Sydney - Orange while Dr Jung-Sup Choi was an International Visiting Scholar, August 2001. Professor Choi wishes to thank the Australia-Korea Foundation for financial support for the visit. The authors wish to thank the two anonymous referees and the Editors of the Australian Agribusiness Review for their critical but constructive comments on an earlier version of the paper and Marjorie Wilson for her editorial assistance. 2 - The fact that Koreans prefer domestic beef to imported beef is largely due to the following two reasons: (1) before beef market liberalisation on 1 January 2001, all imported beef was frozen; and (2) comparison between domestic and imported beef was very limited due to the dual retail system. 3 - Before the market liberalisation, Korean beef policy had focused on trade restrictions and price control, using imported beef as a policy measure to press down the domestic beef prices. With the market opening, the domestic beef policy shifted to non-market measures such as direct payments, disease management, and subsidies for environmental facilities. 4 - Typically the cooperatives feed castrated bulls to achieve a high-level marbling. Average sales per month for each cooperative are about 60 head. As of early 2001, the number of cattle kept by all brand named cooperatives reached 122456 head, accounting for about 9 per cent of the total cattle herd in Korea. Average cattle herd size is 1275 per cooperative. Among the cattle herd, 46 per cent were castrated bulls, 22 per cent were bulls, and the remaining 32 per cent were cows. 5 - To date, there has been little offshore investment in beef production by Korean firms as compared with the Japanese involvement in the Australian beef sector. It has yet to be seen whether the Koreans will follow similar approaches to those of the Japanese. 6 - There was an increase in the tariff rate in 1995 as a result of implementing GATT Uruguay Round negotiations, which is also subject to reduction over the following years as shown in Table 11. However, in the same year, import quota was also increased and was scheduled to increase further. Increased import quota means reduced protection. |
||||||||||||||||||||||||||||||||||||||||||||||||||||||||||||||||||||||||||||||||||||||||||||||||||||||||||||||||||||||||||||||||||||||||||||||||||||||||||||||||||||||||||||||||||||||||||||||||||||||||||||||||||||||||||||||||||||||||||||||||||||||||||||||||||||||||||||||||||||||||||||||||||||||||||||||||||||||||||||||||||||||||||||||||||||||||||||||||||||||||||||||||||||||||||||||||||||||||||||||||||||||||||||||||||||||||||||||||||||||||||||||||||||||||||||||||||||||||||||||||||||||||||||||||||||||||||||||||||||||||||||||||||||||||||||||||||||||||||||||||||||||||||||||||||||||||||||||||||||||||||||||||||||||||||||||||||||||||||||||||||||||||||||||||||||||||||||||||||||||||||||||||||||||||||||||||||||||||||||||||||||||||||||||||||||||||||||||||||||||||||||||||||||||||||||||||||||||||||||||||||||||||||||||||||||||||||||||||||||||||||||||||||||||||||||||||||||||||||||
|
Contact the University : Disclaimer & Copyright : Privacy : Accessibility |
|
Date Created: 04 June 2005 |
The University of Melbourne ABN: 84 002 705 224 
|