|
|

|
Agribusiness Review - Vol. 9 - 2001
Paper 1
ISSN 1442-6951
Farmer Returns from New Technologies in the Australian Beef Industry:
On-farm Research versus Off-farm Research
February 6, 2001
Xueyan Zhao, Garry Griffith and John Mullen*
* The authors are Lecturer, School of Economics, University of Adelaide; and Principal Research Scientists, NSW Agriculture, Armidale and Orange respectively.
This is a revised and condensed version of a paper presented at the 44 th Annual Conference of the Australian Agricultural and Resource Economics Society, University of Sydney, 23-25 January, 2000.
The work is drawn from Xueyan Zhao's PhD dissertation accepted by the University of New England.
We thank an anonymous referee for useful comments.
Abstract
The issue of the relative returns to farmers from on-farm research versus off-farm research is examined using a multi-sectoral equilibrium displacement model of the Australian beef industry. Total economic surplus changes and their distributions among various industry groups resulting from 1% cost reductions in various farm sectors (weaner production, cattle backgrounding and grass-finishing) and off-farm sectors (feed lotting, processing, and domestic and export marketing) are estimated. The results are consistent with previous studies in showing that in general, the share of total benefits to farmers is larger from on-farm research than from off-farm research. The exception is the export marketing sector. The net returns from the different cost reduction scenarios depend on the costs of achieving them.
The cattle and beef industry is a major component of the Australian agricultural sector: Its farm-gate earnings are about $4 billion per annum and about two-thirds of its output is exported, earning almost $3 billion per annum, or about one-third of all farm export revenue (ABARE 1998). In recent years, the beef industry has faced more competition both domestically and internationally. On the domestic market, chicken and pork have gained an increased share of meat consumption at the expense of beef (ABARE 1998). Overseas, liberalisation of some Asian markets has provided more opportunities for the industry, but the recent Asian economic crisis has also imposed challenges. While the beef import quota in the United States has been terminated, some South American exporters have achieved foot-and-mouth free status and are seeking a greater share of the United States market. In addition, there have been a greater number of chemical residue and food safety incidents in the world meat market. In such a competitive and rapidly changing environment, it is vital that the scarce research and development (R&D) and market promotion funds available to the beef industry be used in the most efficient way to enhance industry competitiveness.
R&D funds can be used for on-farm investments targeting farm productivity, or for off-farm investments aimed at improving efficiency in the feedlotting, processing, or domestic or export marketing sectors. Market promotion funds can be allocated to either the domestic market or any of a number of export markets. Total annual expenditure on R&D and promotion for the beef and sheep meat industries has reached $100 million in recent years (MLA 1998/99). In 1998/99, about half the available funds were spent on promotion and about half on R&D programs. Of this latter expenditure, 21% was spent on R&D in the farm and feedlot sectors, 9% was spent on R&D in the processing sector, and the remaining 19% was spent on R&D programs which address issues affecting all sectors of the industry.
Efficient allocation of research funds between alternative investments requires knowledge of the rate of return earned by these investments and their riskiness. Cattle farmers, for example, need to relate the benefits they receive from alternative investments to the costs to them of these investments. Both the benefits from new technologies and the incidence of levies to fund R&D, are shared by farmers, processors and consumers. Hence, for say, cattle farmers, to know the returns from their investments in on-farm R&D they need to know not only total industry costs and benefits from such research but also how these total costs and benefits are shared with others in the industry, which in this case include feedlotters, processors, exporters, retailers, and domestic and export consumers. In general farmers receive a larger share of the benefits from on-farm research than from off-farm research and promotion. The implication of this, expanded on below, is that in choosing between on- and off-farm research and promotion, farmers need to consider not only total industry benefits from these investments but also their share of these total benefits. Some relevant tradeoffs might include expenditure on R&D versus promotion, domestic promotion versus overseas promotion, R&D into grass-finishing cattle versus grain-finishing cattle, and traditional on-farm R&D versus off-farm R&D in sectors such as feedlotting, processing and marketing.
In this paper, the focus is on this last issue. As observed in Scobie, Mullen and Alston (1991), some hold the view that agricultural R&D funds should be diverted from traditional on-farm research to off-farm research because the value added to a farm product in processing is often larger than the value of the farm product, and thus a 1% gain in processing efficiency will give higher total returns than a 1% gain in farm efficiency. Some also believe that because of past R&D efforts, the big gains in farm productivity have been made already but that the potential for productivity gains in processing is still large.
There have been some studies comparing returns from farm-oriented research and processing and marketing research. Under the assumption of zero input substitution between the farm input (the agricultural raw material) and other inputs used in processing and marketing (such as labour and capital), Freebairn, Davis and Edwards (1982) concluded that the distribution of the total benefits among farmers and consumers is the same whether the cost reduction occurs in the farm sector or in the off-farm (marketing) sectors. This is the same as assuming that inputs must be used in fixed proportions to each other. Alston and Scobie (1983) showed that, once input substitution is allowed (or that inputs can be used in variable proportions), farmers will gain a greater proportion of total returns from research at the farm level than from research at the marketing level. In fact, farmers can even lose from non-farm research.
This finding was confirmed by Mullen, Alston and Wohlgenant (1989) for the Australian wool industry. Holloway (1989) further investigated the issue by separating the marketing sector into two sequential stages - processing and distribution. He pointed out that when the degree of substitution between farm and non-farm inputs is different in the two marketing sectors, the benefits to farmers depend crucially on the stage in the marketing system where the research occurs. However, all previous studies have used quite aggregated market structures and no study has examined this issue for the Australian beef industry. The objective of this paper then is to revisit the issue of farm research versus off-farm research in the context of the Australian beef industry which is disaggregated both vertically into a number of production and marketing stages and horizontally into grain- and grass-finishing streams and domestic and export markets.
A Disaggregated Model of the Beef Industry
A disaggregated equilibrium displacement model of the Australian beef industry developed in Zhao (2000) is used in this paper to examine the returns from different types of on-farm and off-farm R&D investments. The approach involves estimating changes in economic surplus from efficiency gains in a partial equilibrium displacement framework. With this approach, the equilibrium of the industry is represented by a system of demand and supply relationships for each sector of the industry. The impacts of new technologies, promotional campaigns and government policies, are modelled as shifts in demand or supply curves in the relevant markets. Comparative static analysis is used to linearly approximate changes in prices and quantities of all outputs and inputs from 1% reductions in production or processing costs or from 1% increases in demand in the case of promotion (see Zhao, Mullen and Griffith 1997). The consequent changes in producer and consumer surpluses are then estimated as welfare changes to various industry groups. A review of the equilibrium displacement modeling approach can be found in Alston, Norton and Pardey (1995).
The Australian beef industry involves multiple markets and multiple production and marketing stages. In order to study the returns from various types of on-farm and off-farm research investments and the distribution of benefits among different industry sectors, a model disaggregated along both vertical and horizontal directions is required. About two-thirds of Australian-produced beef is sold overseas, so both domestic and export markets need to be included, and about 14% of exported beef and 18% of domesticly consumed beef are grain finished in feedlots, so both grass-finished and grain-finished product needs to be included. Vertically, production of retail beef products involves breeding, backgrounding, grain or grass finishing, processing, and domestic or export marketing.
The structure of the model reflects these requirements. Importantly, the model includes four end products domestic grass- and grain- fed beef and export grass- and grain-fed beef. These four products have different market specifications at all production and marketing stages and each comprises a significant share of the industry. This disaggregated specification enables the analysis of technical changes in individual sectors and promotion in different markets. It also enables the identification of benefits to individual industry sectors. A formal technical account of the model specification and assumptions made is given in Zhao (2000) and Zhao, Mullen and Griffith (2000).
Data Requirements
The information required for operating the equilibrium displacement model is in three parts: (1) initial price and quantity values for all inputs and outputs, which define the equilibrium status of the system before the introduction of new technology or promotion; (2) market elasticities, which describe the market responsiveness of quantity variables to price changes; and (3) the values of all the variables which quantify the effects of new technologies and promotions. The initial equilibrium values are specified as the average prices and quantities for the period 1992-97. Significant effort was invested in Zhao (2000) to compile a set of equilibrium prices and quantities for all sectors and product types at the required level of disaggregation.
This includes prices and quantities of weaners, backgrounded cattle, grass/grain finished cattle, processed beef carcass, and final products as f.o.b. (free on board) export boxes and domestic retail cuts. Zhao and Griffith (2000) used published data from various government and industry agencies and other available sources and made assumptions regarding the relationship of cattle prices and quantities at different levels to derive nonrecorded prices and quantities required in the model. Details about the data sources, the assumptions made and the derivation of prices and quantities of all sectors for each year of 1992 to 1997 are given in Zhao (2000, Appendix 3) and Zhao and Griffith (2000). Market elasticities were required to solve the displacement model. These include supply elasticities of factor inputs, demand elasticities of final products, and input substitution and output transformation elasticities among inputs and outputs of all sectors.
Values for these elasticities were specified based on economic theory, reviews of existing empirical estimates (Griffith et al 2000a, Griffith et al 2000b) and subjective judgement. They are provided in Table 1. Full details of the selected specification of the market elasticities are given in Zhao (2000). Since non-zero input substitution elasticities are assumed for all sectors in the study, the welfare distribution among industry groups will be different when the R&D occurs at different points of the production and marketing chain.
Table 1. Selected Elasticity Values for the Equilibrium Displacement Model
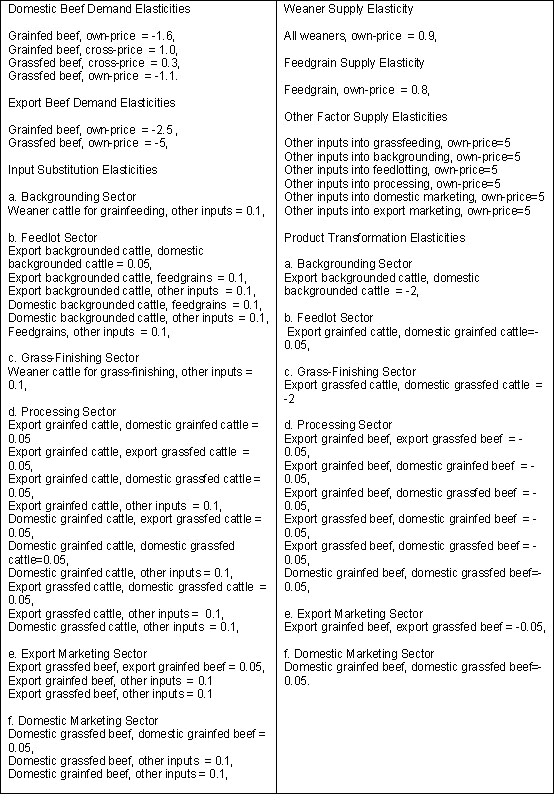
Where published estimates are limited, subjective judgement is required in order to choose a set of most likely' elasticity values. A stochastic approach to sensitivity analysis is used below to systematically study the robustness of results to uncertainty in market elasticities. New technologies were modelled as reducing the costs of production or processing, or in other words, as shifts in supply. Promotion was modelled as a shift in demand. There were 12 different technology and promotion scenarios and equal 1% shifts in the relevant supply or demand curves were assumed for all scenarios. This allows for the simulation of the impacts of 1% cost reductions in various production and processing sectors and 1% increases in consumer's willingness to pay' in the end product or retail markets. As the focus in this paper is on comparison of returns from different types of research investments, only the seven beef industry research scenarios are discussed here.
Returns from On-farm versus Off-farm Research
Typically, research into new technologies in weaner production (Scenario 1, Table 2), cattle grass-finishing (Scenario 2) and cattle backgrounding (Scenario 3) is regarded as 'traditional' on-farm research. Examples include genetic research increasing calving percentage, pasture research increasing grazing efficiency or education initiatives improving producers' farm management. Off-farm research is R&D beyond the farm gate. In the model, cost reductions in feedlots (Scenario 5), abattoirs (Scenario 6) and domestic (Scenario 7) and export (Scenario 8) marketing sectors relate to off-farm R&D investments.
Table 2. Economic Surplus Changes (in $million) and Percentage Shares of Total Surplus Changes (in %) to Various Industry Groups from Alternative Research Investment Scenarios
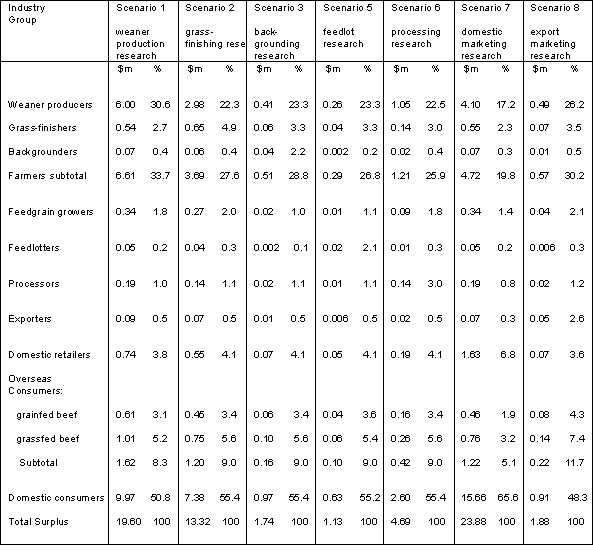
Using the specified initial prices and quantities and market elasticities, the results of the total economic surplus changes and their distribution among industry groups for each of the seven specified research scenarios are given in Table 2. Some qualification of the results should be noted before any comparison is undertaken. First, the results relate to equal 1% exogenous shifts in the relevant supply curves. The question of how much money is required to bring about the 1% cost reductions in the relevant sectors is not discussed here. Previous studies that have addressed this issue include Lemieux and Wohlgenant (1989), Scobie, Mullen and Alston (1991), Mullen and Cox (1995) and Cox, Mullen and Hu (1997). Thus, the monetary returns from alternative scenarios in Table 1 are only comparable under the assumption of equal investment efficiency, in the sense that the investment costs of the 1% shifts in all sectors are the same.
Second, although the same amount of monetary investments at different points of the industry may result in supply shifts of different magnitudes, and although the actual returns in dollar terms are dependent on the magnitudes of the initial shifts, the distribution of the total benefits among industry groups for a particular scenario is independent of the size of the initial shift (Zhao 2000, p160). For example, the farmers' percentage share of the total benefits from processing technology (i.e. 25.9% for Scenario 6 in Table 2) is the same regardless of whether the technology reduces the processing cost by 1% or 10%. Therefore, comparison of benefit shares among alternative investment scenarios is always meaningful even without knowledge of the efficiency of research investments. This result follows from the assumed competitive structure of the beef industry and the assumed parallel supply and demand shifts.
Consider now the total welfare gains from the alternative scenarios. For the same 1% exogenous shift, the size of the total welfare change from a scenario is predominantly determined by the gross revenue of the market where the exogenous shift occurs. Consequently, as can be seen from the last row of Table 2, for equal 1% shifts in the relevant markets, domestic beef marketing technology (Scenario 7) and weaner production research (Scenario 1) result in the largest total returns: $23.88 million and $19.60 million, respectively. These are followed by grass-finishing research (Scenario 2, $13.32 million). The total benefits from 1% cost reductions in the backgrounding, feedlot, processing and export marketing sectors are much smaller (mainly less than $2 million) due to the small value added to the cattle/beef products in these sectors. For all seven research scenarios, the majority of the total benefits accrue to domestic consumers and cattle farmers. Domestic consumers gain the largest share of total benefits (48.3% to 65.6%) in all seven cases. This is because domestic retail beef comprises the bulk of total industry value at retail and because domestic beef demand is assumed far from perfectly elastic. Farmers, including weaner producers, grass-finishers and backgrounders, receive between 19.8% to 33.7% of total benefits for the seven scenarios.
Overseas consumers and domestic retailers are the other two groups who gain significant shares of total returns. Although more than half of Australian beef goes overseas, the total value of export beef (valued at f.o.b.) is much smaller than the value of domestic beef at retail. More importantly, overseas demand for Australian beef (both grainfed and grassfed) is substantially more elastic than domestic demand. As a result, overseas consumers gain much less surplus than domestic consumers in all cases. The shares of the total surplus gains to overseas consumers range from 5.1% to 11.7%. Domestic retailers gain 3.6% to 6.8% of total benefits in all scenarios. Beef value is more than doubled through the domestic marketing sector, which makes the value of the retail sector substantial.
However, the assumption of a highly elastic supply of marketing inputs (with an elasticity of 5) means that the welfare gain to the retail sector is still rather small. An elastic supply curve for marketing inputs, for example, means that marketing firms can buy more of these inputs (labour, capital etc) if they need them without paying suppliers a significantly higher price. The shares of benefits to feedgrain producers, feedlotters, processors and exporters are very small for all investment scenarios (mostly less than 3%). The values added to the cattle/beef products in the feedlots and abattoirs are small, and the supply curves of other inputs in these sectors are assumed to be highly elastic (with an elasticity value of 5). Next consider the farmers' shares of total benefits from on-farm research versus off-farm research in Table 2. Farmers receive a larger share of the total benefits from on-farm research (33.7%, 27.6% and 28.8% for Scenarios 1, 2 and 3 respectively) than from feedlot (26.8%) and processing (25.9%) research.
However, the comparison between farm research and marketing research shows different results for domestic and export marketing. The domestic marketing sector research is shown to give farmers a much lower proportion of benefit (19.8%) than all types of farm production research. However, export marketing research is shown to give farmers a larger share of the benefits (30.2%) than for some types of on-farm research. The reason that cost reductions in export marketing give farmers a much larger share of benefits than domestic marketing is that, in comparison to domestic marketing, the export marketing sector is much smaller in value and overseas consumers have a much more elastic demand. Since export consumers and marketers (due to a large elasticity value of 5 for the marketing input supply) are consequently unable to appropriate the benefits from efficiencies in export marketing, the benefits flow naturally back to farmers rather than to domestic marketers and consumers.
In summary, the results from the present model are consistent with the previous literature in concluding that, in terms of the shares of total benefits, farmers should prefer on-farm R&D to R&D in feedlots, processing and domestic marketing sectors. However, they should also be interested in export marketing research, which may provide them with an even larger share than some post-weaning farm research. As for Australian consumers, the preference between farm research and off-farm research is inconclusive. While they gain an overwhelmingly larger proportion of the benefits from domestic marketing research (65.6%) and relatively lower shares for weaner production research (50.8%) and export marketing research (48.3%), their shares for the other on-farm and post-farm research scenarios are very similar (55.2% to 55.4%). Feedlotters, processors and marketers each receive a significantly larger share for research occurring in their own sector. Otherwise, these groups are mostly indifferent among other types of on-farm and off-farm research investments.
The comparison among alternative research investments in the literature and in this study to this point has focused on the percentage shares of the total benefits to individual groups, irrespective of the total dollar benefits of different scenarios. As the information on the costs involved in bringing about the same 1% shifts in the various markets is unavailable, the conclusions that can be drawn from comparing the actual dollar returns from alternative investment scenarios are limited. As noted above, one way around this is to make an assumption of equally efficient investments in all sectors (same $ investment for same % shift). For example, if the R&D investments in marketing research were equally efficient in the two marketing sectors, producers would prefer domestic marketing research ($4.72 million) to export marketing research ($0.57 million), even though the shares of total benefits give the opposite preference (19.8% for domestic and 30.2% for export). Or, from a different perspective, investment in export marketing research needs to be eight times as efficient (4.72/0.57 is 8.28) as investment in domestic marketing research in order for farmers to be indifferent about investing in the two marketing sectors.
Table 3 . Rankings of Preferences to Farmers Among the Alternate Research Investment Scenarios
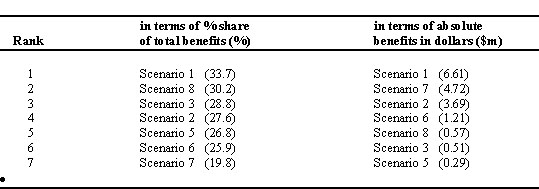
The rankings of preferences to farmers among the seven alternative investment scenarios, in terms of their percentage shares of total benefits and in terms of their absolute monetary benefits respectively, are given in Table 3. The ranking in the first column is always true even though the information on the investment costs involved in the initial 1% shifts is unavailable. The ranking in the second column is conditional on the assumption of equal efficiency across the seven scenarios. Obviously, the ranking of preferences in the two columns is rather different, although Scenario 1 is consistently ranked first.
Table 4. Required Percentage Shifts Necessary to Provide the Same Benefits to Farmers as from Scenario 1 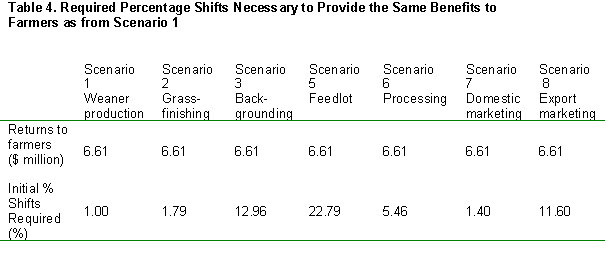 |
More insights may also be gained from the information given in Table 4, which lists the initial percentage shifts required in all scenarios that are necessary to achieve the same dollar benefits as that from Scenario 1. For example, in order for farmers to receive the same monetary benefit of $6.61 million as from a 1% cost reduction in weaner production (Scenario 1), costs in cattle processing need to be reduced by 5.46% (Scenario 6), or costs in feedlotting need to be reduced by 22.79% (Scenario 5).
Similarly, in order for farmers to be indifferent about investing in grass-finishing research (Scenario 2) or in export marketing research (Scenario 8), the cost of creating a technology that reduces grass-finishing costs by 1.79% needs to be the same as the R&D investment that reduces export marketing costs by 11.60%. Thus, which of the two investment scenarios is preferable to producers is dependent upon the investment costs in bringing about the 1.79% and 11.60% shifts in these two sectors. Finally, the impact of levies paid to fund research is not discussed. In a competitive industry, the industry equilibrium will be displaced as a result of the imposition of a levy. For example, a levy on cattle farmers would be regarded initially as an increase in cattle production costs.
However, through the interaction with other sectors in the production and marketing chain, this cost is ultimately shared with feedlotters, processors and consumers. Hence, farmers do not bear the levy burden alone even if the levy is collected from them initially. There is also a symmetry between how the benefits from technology are distributed between the different sectors in the beef industry and how the incidence of levies imposed to fund R&D and promotion are shared between the different sectors. A levy on the producers of weaners is distributed in exactly the same way as the benefits of new technology in growing weaners these farmers pay 30.6 per cent of the levy and gain 30.6 per cent of the benefits.
However if the levy is used to fund domestic marketing research for example, they still pay 30.6 percent of the levy but receive only 17.2 per cent of the benefits. As has been emphasised throughout this paper, domestic marketing research may still be a profitable investment for weaner producers but the rate of total returns to investments in this area will have to be higher than from weaner R&D to give the same net returns to weaner producers. These issues are examined more fully in Alston and Mullen (1992) and Piggott (1998).
Sensitivity to Market Elasticity Values
The results presented above are based on a particular set of market-related elasticities which were chosen from published estimates, economic theory and the authors' subjective judgement. For some parameters, there are relatively more empirical studies available and the possible values of the parameters can be narrowed down to small ranges. However, for others, and in particular given the level of disaggregation in this study, very little empirical evidence is available. Specification of these parameter values in the base model has had to rely substantially on subjective judgement. Thus, it is essential to study the sensitivity of model results and their policy-related conclusions to changes in values of parameters.
A stochastic approach to sensitivity analysis is used in this study, as proposed in Zhao et al. (2000) (see also Davis and Espinoza 1998; Griffiths and Zhao 2000). This is one of several options for handling the problem of uncertainty in input parameters, or more generally, in benefit estimation. Discrete sensitivity analysis is a possibility, but given the large number of parameters involved, it is difficult to obtain a complete picture of the impacts on model results using these methods. Scobie and Jacobsen (1992) argue that there is a close parallel between investment in research and other forms of investment and they propose a portfolio allocation approach to deal with the risk of investing in research programs. However Bardsley (1999) has questioned the assumptions underlying application of this approach to research portfolios, in particular, the nature of the principal-agent relationship in the two cases.
In the chosen method, subjective probability distributions are specified to characterise both the uncertainty in parameter values and the correlations among different parameters. These distributions are carefully chosen (including truncations and combinations of distributions in order to be consistent with the subjective probability belief of value ranges) so that 'unfavourable' draws (such as the ones with wrong signs) will not occur. Additionally, "integrability" restrictions and any inequality restrictions among parameters required by economic theory are imposed to make sure that each set of parameter draws is a proper set of possible parameters. The implied probability distributions for the benefit measures are then obtained through Monte Carlo simulation of the model. From these distributions, mean values, standard deviations and 95% probability intervals can be calculated for the results given in Table 2.
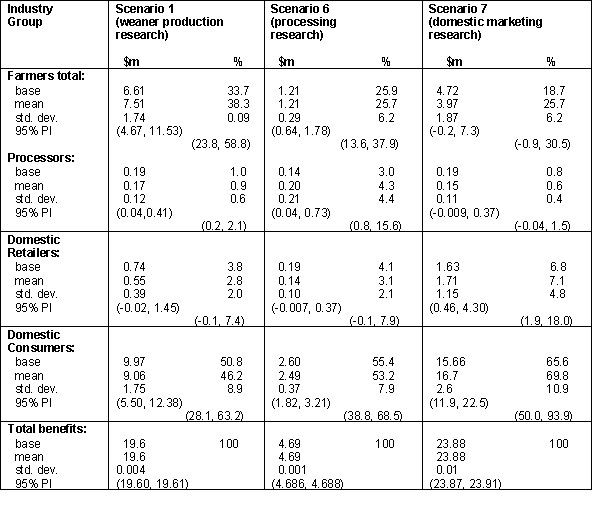
Table 5 . Summary Statistics for Welfare Benefits (in $million) and Shares of the Total Benefits (in %) for Various Industry Groups 1
1. Figures on the left of each cell are the monetary benefits and figures on the right are the percentage shares of total benefits, for individual groups.
Some selected results are reported in Table 5. First, it is evident that total benefits are almost completely insensitive to different elasticity values. This confirms prior expectations (Zhao, Mullen and Griffith 1997). Second, the distribution of total benefits is quite sensitive to different elasticity values. For example, given the uncertainty in elasticities specified in the subjective distributions, we can state that we are 95% confident that farmers will gain between $4.67 million and $11.53 million from weaner research (Scenario 1). The best bet' estimate in the base run is $6.61 million. Similarly, we can also state that we are 95% confident that farmers will gain between 23.8% and 58.8% of the total benefits from weaner research.
The best bet' estimate in the base run is 33.7%. Conversely, while the point estimate for farmers' gain from domestic marketing research (Scenario 7) is $4.72 million, the 95% probability interval is -$0.2 million to $7.3 million, which suggests a possible welfare loss. In fact, from the simulation data, it can be calculated that there is a 3.2% chance that cattle farmers will lose from research dollars invested in the domestic marketing sector. This arises because of some large values allowed in the distributions of input substitution elasticities. Other results in Table 5 also suggest that some sectors can lose from research conducted in another sector. Overall though, the conclusions about farmers' preferences among different types of on-farm and off-farm research, in terms of their shares of the total benefits, are shown to be robust with very high probabilities.
In recent years, around $100 million has been spent annually on R&D and promotion in the Australian red meat industries. The money comes from levies paid by farmer groups and from government contributions for research. Decisions have to be made on how to allocate these funds between R&D and promotion, and between various programs within these broad categories. In this paper, the issue of the returns from on-farm research versus off-farm research was examined using a multi-sectoral equilibrium displacement model of the Australian beef industry.
Total economic surplus changes and their distributions among various industry groups resulting from 1% cost reductions in various farm sectors (weaner production, cattle backgrounding and grass-finishing) and off-farm sectors (feedlotting, processing, and domestic and export marketing) were estimated. The results are consistent with previous studies in showing that farmers will receive higher shares of total benefits from all types of farm research than research in the feedlotting, processing and domestic marketing sectors. However, research into export marketing was shown to be more preferable to farmers, in terms of their shares of the total returns, than some on-farm investments such as those in the cattle backgrounding and post-weaner grass-finishing.
Note also that it is only when levies are invested in the sector in which they are raised that the distribution of the benefits from the technology is exactly the same as the incidence of the levy. Complete cost-benefit analyses of alternative investments in the beef industry requires information on both the costs and the benefits of the modelled 1% initial shifts. The results presented in this study provide information about the benefits of alternative investment scenarios, but the costs involved in bringing about the 1% shifts were not examined. Without the cost information, only the percentage shares of the total benefits are strictly comparable among alternative investment scenarios, although more information can be obtained if an assumption of equally efficient research is invoked. However, the model in this study provides a framework for a complete cost-benefit analysis of alternative investments once the information on the investment costs or efficiency in different sectors is available.
ABARE (1998), Australian Commodity Statistics, Australian Bureau of Agricultural and Resource Economics, Canberra (and previous issues).
Alston, J.M., G.W. Norton and P.G. Pardey (1995), Science Under Scarcity: Principles and Practice for Agricultural Research Evaluation and Priority Setting, Cornell University Press, Ithaca and London.
Alston, J.M. and J.D. Mullen (1992), 'Economic effects of research into traded goods: the case of Australian wool', Journal of Agricultural Economics 43(2), 268-78.
Alston, J.M. and G.M. Scobie (1983), "Distribution of research gains in multistage production systems: comment", American Journal of Agricultural Economics 65(2), 353-6.
Bardsley, P. (1999), "The optimal management of research portfolios", Australian Journal of Agricultural and Resource Economics 43(3), 323-35.
Chambers, R. G. (1991), Applied Production Analysis: A Dual Approach, Cambridge University Press, Cambridge.
Cox, T., J. Mullen and W. Hu (1997), "Nonparametric measures of the impact of public research expenditures on Australian broadacre agriculture", Australian Journal of Agricultural and Resource Economics 41(3), 333-60.
Davis, G. C. and M. C. Espinoza (1998), A unified approach to sensitivity analysis in equilibrium displacement models, American Journal of Agricultural Economics 80(4), 868-79.
Freebairn, J.W., J.S. Davis and G.W. Edwards (1982), "Distribution of research gains in multistage production systems", American Journal of Agricultural Economics 64(1), 39-46.
Griffith, G., K. I'Anson, D. Hill, R. Lubett and D. Vere (2000a), Previous Demand Elasticity Estimates for Australian Meat Products, NSW Agriculture, Economics Research Report, Armidale (in process).
Griffith, G., K. I'Anson, D. Hill and D. Vere (2000b), Previous Supply Elasticity Estimates for Australian Broadacre Agriculture, NSW Agriculture, Economics Research Report, Armidale (in process).
Griffiths, W.E. and X. Zhao (2000), A unified approach to sensitivity analysis in equilibrium displacement models: comment, American Journal of Agricultural Economics 82(1), 236-40.
Holloway, G.J. (1989), "Distribution of research gains in multistage production systems: further results", American Journal of Agricultural Economics 71(2), 338-43.
Lemieux, C.M. and M.K. Wohlgenant (1989), "Ex ante evaluation of the economic impact of agricultural biotechnology: the case of porcine somatotropin, American Journal of Agricultural Economics 71(4), 903-14. MLA (1998/99), Creating Opportunities for Your Business Work Program 1998/99, Meat and Livestock Australia, Sydney.
Mullen, J.D., J.M. Alston and M.K. Wohlgenant (1989), The impact of farm and processing research on the Australian wool industry, Australian Journal of Agricultural Economics 33(1), 32-47.
Mullen, J. D. and T. L. Cox (1995), "The returns from research in Australian broadacre agriculture", Australian Journal of Agricultural Economics 39(2), 105-28.
Piggott, R.R. (1998), Spending the Pastoralists' Levy Dollars: Promotion vs Research, Inaugural Public Lecture, University of New England, Armidale, 11 September.
Scobie, G.M., J.D. Mullen and J.M. Alston (1991), The returns to investment in research on Australian wool production, Australian Journal of Agricultural Economics 35(2), 179-95.
Scobie, G.M. and V. Jacobsen (1992), Allocation of R&D Funds in the Australian Wool Industry, Report prepared for the Wool Research and Development Corporation, Department of Economics, University of Waikato, Hamilton.
Zhao, X. (2000), The Economic Impacts of New Technologies and Promotions on the Australian Beef Industry, unpublished PhD thesis, Graduate School of Agricultural and Resource Economics, University of New England, Armidale.
style=" word-spacing: 2; line-height: 100%; ">Zhao, X. and G.R. Griffith (2000), Specification of Equilibrium Prices and Quantities for Disaggregated Beef Industry Sectors for 1992-1997, NSW Agriculture, Economics Research Report, Armidale (in process). Zhao, X., W.E. Griffiths, G.R. Griffith and J.D. Mullen (2000), Probability distributions for economic surplus changes: the case of technical change in the Australian wool industry, Australian Journal of Agricultural Economics 44(1), 83-106.
Zhao, X., J.D. Mullen and G.R. Griffith (1997), "Functional forms, exogenous shifts, and economic surplus changes", American Journal of Agricultural Economics 79(4), 1243-51.
style=" word-spacing: 2; line-height: 100%; ">Zhao, X., J.D. Mullen, G.R. Griffith, W.E. Griffiths and R.R. Piggott (2000), An Equilibrium Displacement Model of the Australian Beef Industry, NSW Agriculture, Economics Research Report, Armidale (in process).
|