|
|
|
|||

Department of Agriculture and Food Systems
|
||||
|
||||
|
|
|
|||
Department of Agriculture and Food Systems
|
||||
|
||||
|
|
Agribusiness Review - Vol. 6 - 1998Paper 12 THE VALUE OF BARLEY PROTEIN IN LIVESTOCK FEEDING IN QUEENSLANDJyothi V Gali, Colin Brown, and Malcolm Wegener The authors gratefully acknowledge the comments of two anonymous referees that assisted in the preparation of this paper. ABSTRACTThe impact of protein content of feed barley in the diets of beef , dairy cattle and pig in Queensland is evaluated. A model based on the least cost feed ration analyzes the marginal value of additional protein content in feed barley for different liveweights of animals. The results indicate that higher protein levels in feed barley generally have a low feed value to livestock feeders. Therefore, efforts to improve market arrangements by introducing premiums for higher protein in the feed barley market would not seem desirable even with the present expansion of feedlots and their perceived need for quality grains in Queensland. KEYWORDS: barley, protein, feed rations, Queensland livestock industry
IntroductionAs with many other rural industries in Australia, dramatic changes have occurred recently in the Queensland barley market. Changes in both domestic and international markets have seen a relative shift in demand from malting barley to feed barley. The demand shifts in combination with extremely volatile production conditions pose major challenges for producers in deciding what crops to produce and for marketing agencies in handling the crop. All this has occurred at a time when the market has been all but completely deregulated opening up an array of new marketing channels for barley growers and barley users. Participants in the barley market need more sophisticated information if they are to adjust optimally to this new agribusiness environment. Perhaps the most fundamental change in the Queensland barley market has been the shift in demand from malting barley to feed barley. Although barley has many important attributes for its end users, protein content is important to both maltsters and livestock feeders. However, while the protein range for malting barley and its associated premiums and discounts are tightly defined, there are no premiums or discounts for protein in feed barley. The lack of differential protein payments raises a number of issues for the rapidly developing feed barley market. Specifically, should livestock feeders use barley for both energy and protein or should they source the protein from other products? Similarly, should feed barley growers alter their management and agronomic practices to try to produce grain with a particular protein content? Should plant breeders change their objectives to release feed grain rather than malting barley varieties? And should marketing specifications in the form of grading or product descriptions and an appropriate pricing system be implemented to allow more accurate reflection of the value of protein in feed barley? This paper seeks to provide information to address partly some of these questions. To set the scene, more background to these issues is provided in the following section. A model with its origins in Von Liebig's' Law of the Minimum' is used to determine the marginal value of additional protein in feed barley to various livestock feeders. The marginal value of protein is then reported for different protein percentages, types of livestock and liveweights. Some implications of the results for barley growers, livestock feeders and other barley market participants are then reported. BackgroundFeed grain is the single most important input in intensive livestock feeding because of its moderate protein level, high-energy content and low price relative to other ingredients of equivalent feed value. The quality of meat from an animal depends on the quality of the feed it consumes. Each feed grain has a specific use because of its product characteristics. Sometimes it may be possible to substitute one grain with other similar types but this substitution may not always be perfect. Feed grain, in combination with hay also has a role in lessening the seasonal variation in fodder supplies in the extensive sheep and cattle grazing industries. Bain (1973) argued that in times of drought, grain becomes important in ensuring the survival of a nucleus of breeding animals. Barley has always been a popular grain in feeding livestock . In many parts of the world, barley forms the major constituent in the diets of pigs and ruminants. In the "barley beef" system of cattle feeding, cattle are fattened on concentrated diets consisting of about 85 per cent barley without the use of roughage. The major users of feed grains are the broiler, egg, pig, dairy and feedlot cattle industries. These users account for more than 95 per cent of overall stock feed consumption in Australia (Minett 1994) . Extensive livestock industries are minor users and they use feed grain only in years when there is a pasture shortage or when livestock prices are high. There has been a marked upward trend in feed grain consumption both in Queensland and Australia over the past 10 years and this is expected to continue ( Thompson 1995 and Meyers Strategy Group 1995 ). Livestock differ in their nutritional requirements according to their economic output. Therefore, there is no common basis for comparing the grains for all purposes, as the digestive systems of different animal species require different nutritional specifications to produce products such as eggs, milk, and meat. Thus some livestock need more protein in their feed, others need more energy. However, protein is an important organic compound that is essential for all types of livestock. Protein is normally measured as crude protein, and is essential for the health and growth of animals especially when they are young. Feed grains are a valuable source of protein and energy in the intensive livestock industries. For commercial reasons, feedlot operators have been reluctant to be too precise about the quality specifications required from feed grains. However, many in the grain industry believe that if the feedlot industry wants to ensure security and quality of supply of feed grains in the future, then it must send appropriate signals to grain growers and the research community, so that growers can change their cropping patterns to produce grain of a particular type. If these signals are not available, growers in the long run do not receive the highest possible price because of low quality product. At the same time, feedlots who are trying to source increasingly large quantities of quality grain to meet their quality-conscious livestock markets, may need to pay more than they need to access the required grain. This may be the case especially given the rapid expansion of intensively fed livestock in south-east Queensland and northern New South Wales. The feedlot industry must ensure it is able to source the quantities of quality grain it requires, on a regular basis, by an appropriate strategy instead of finding that grain is not available in years of tight supply conditions. The rapid expansion of the cattle feedlot industry in south-east Queensland and northern New South Wales has increased the level of demand for grains and the demand for specific attributes of various grains. Some feedlotters only buy high protein grain that is above the mean grain protein levels in the region. It is important for livestock producers to know the protein content of the grain that they are buying. Otherwise it may be costly for them to fortify their prepared feed with extra protein later. Generally, all feed grains are bought on average nutritional composition. However, there is wide variation between varieties, within varieties, between regions and between seasons. Thus, livestock feeders implicitly value various attributes of grain in making their purchases. In recognition of these changes and facts, a major investigation into feed grains (Ryan and Associates 1997) identified that the payment for quality was a priority area in the feed industry action plan. The Grains Research and Development Corporation (GRDC) has taken responsibility to co-ordinate the preparation of information on the nutritive value of feed grains for various end-use industries. However, information on nutritive value is needed as well as the economic values of various attributes of barley if appropriate decisions are to be made. Farmers commonly receive significant premiums for high protein content in wheat and in malting barley. In the malting barley market, protein premiums are paid for prescribed levels of protein. These premiums are explicitly' set premiums in the market, based loosely on the supply and demand for these quality attributes. However, the current marketing system may not provide an adequate incentive for producers to grow high quality feed grains. In the feed barley market, there are no premiums even for the highest protein barley. This is an important issue, not only for barley producers who face problems in meeting malting grade standards, but also for livestock feeders who demand high quality grains. The following empirical analysis examines whether or not differences in the protein content of barley lead to a difference in the value of feed. For an attribute or characteristic to command a premium in the feed grain market, livestock feeders must recognize that the attribute has value for them and be assured that the seller is providing that attribute in the grain supplied. The demand for feed barley is derived from the demand for beef, milk, pig meat and other livestock products. In livestock feeding, nutritional requirements, such as certain minimum protein levels, are required to increase the liveweight of cattle and pigs and to increase milk production in dairy cows. This suggests, a priori , that feed barley with a higher protein level would be more valuable to livestock feeders. However, the extent to which it is more valuable is an empirical question that is addressed in the following analysis. Theoretical modelIn order to analyze the marginal value of additional protein in feed barley to various livestock feeders, the least-cost feed rations model for this study was constructed on the basis of one developed by LaFrance and Watts (1986) . Animal diet formulations are generally based upon Von Liebigs Law of the Minimum' which states that the nutrient in shortest supply constrains the rate of growth of an animal. Let Y denote the performance of an animal ( ie., weight gain in cattle and pigs, and milk production in dairy cows), W the liveweight of the animal, and bi the quantity of the i th nutrient consumed per day, then the Law of the Minimum can be written as: (1) Y = Minimum (f1(W,b1),f2(W,b2),...fm(W,bm) Where fi(W, bi) is a function that relates the performance of an animal to the animal liveweight and the amount of i th nutrient consumed. This function translates the desired levels of livestock performance into nutrient requirements. The objective is to find the least cost feed ration that contains the nutrient bi , and to obtain the performance level Y at current liveweight W . That is, (2) Minimize p'x Subject to Ax ? b x ? 0 where xj denotes the quantity of the j th foodstuff, pj is the price of the j th food stuff, and A is a matrix containing elements aij which represent the quantity of the ith nutrient contained in one unit of the j th foodstuff. The vector of cost-minimizing feeds is a function of prices, nutrient requirements, and the nutrient content of feeds, ie. x* = f(p,b,a) The cost function can be obtained by transposing the above function ie., c(p,b,a) =p'f(p,b,a). Let a11 be the amount of protein contained in one unit of feed barley. If the protein content of barley changes from ao11 to a111, ceteris paribus , what effect does this change have on the cost of obtaining the nutrient requirement vector b? That is, what is the price of barley that makes the feeder indifferent between the protein levels? This price (pb) can be represented by (3) c(p,b,ao11,a21,...,amn) = c(pb,b,a111,a21,...,amn) If the change in the quantity of protein contained in one unit of feed barley does not affect the cost of obtaining the nutrient requirements vector b, then there will be no change in the value of the feed barley. This will occur if either barley is not fed in the least-cost rations both before and after the change in protein content, or the protein requirement constraint in the model is slack. If the protein requirement is binding, and feed barley is used in a positive quantity either before or after the change in protein content, then the change in protein content will influence the cost function. This definition of the value of protein in feed barley is appropriate when a change in protein content does not alter the content of other important nutrients. Suppose that the nutrient content of barley changes from ao11 to a111, then the barley feed cost or implicit price of barley pb in the ration can be defined as (4) c(p,b,ao11) = c(pb,b,a111) The definition of pb is derived from the linear programming problem as follows.
Let and
then pb is such that
where is the amount of feed barley in the optimal ration after changing the protein levels in the feed barley. If the implicit price of barley does change the basis solution under the new nutrient content vector for feed barley, then (5) This generalizes to the case where the affected nutrient constraints are binding before or after the change, or both, and where the j th foodstuff is utilized in the least cost ration before or after the change, or both. The critical piece of additional information necessary to deal with these cases is the precise level of nutrient content and price of feed barley that leads to a just-binding constraint, or that the quantity of the j th food stuff is just equal to zero. Since the current problem is two-dimensional, these points are easily found through a simple search procedure. The following section reports the results of applying this procedure to representative liveweights and performance rates for beef cattle, pigs and dairy cattle. The major assumption of the analysis is that barley is the major grain fed in livestock rations in Queensland. Thus changes in protein content do not result in a change in the content of other important nutrients in the feed barley. However, the amount of amino acids contained in feed barley does vary with the protein content. This is particularly important in pig nutrition, as pigs cannot synthesize essential amino acids. The level of barley protein is assumed to vary from 8 per cent to 14 per cent at 0.2 per cent intervals, with 11 per cent considered as being the standard level of protein content in Queensland (QDPI 1982). However, the mean or modal protein content varies according to seasonal conditions. The major limitation of the model is the realism of applying Von Leibig's Law to livestock performance given the lack of precise information about how the animals will perform when nutrients are partly deficient. However, its strongest advantage is in its simplicity in providing the required information and, as such, the law has found widespread usage in feed ration formulations and their cost minimization. DataFeeds and price information on all feed grains and feed ingredients included in the study came from the Pig Nutrition Information Service of the Queensland Department of Primary Industries, Toowoomba (QDPI 1994) . The study drew on information on barley, cottonseed meal, meat and bone meal, and soybean meal. Prices were calculated as a simple average of the respective prices at Toowoomba in Queensland for the period 1989 to 1993, to eliminate seasonal fluctuations during these years. The base prices used in the analysis were barley (11 per cent crude protein) $156.2/t, meat and bone meal (50 per cent crude protein) $384.8/t, cotton meal (37 per cent crude protein) $277.1/t, and soybean meal (45 per cent crude protein) $442.6/t. The nutrient requirements, liveweight and livestock product categories included in this study for finishing steers, dairy cattle and pigs are outlined in Table 1. Nutrient requirements for the different livestock types and categories were taken from the NRC (1976, 1978, and 1979) tables and Farm Management Handbook (1982). However, for the dairy analysis, these reports did not include the desired liveweight and milk production rates. Therefore the nutrient requirements for different liveweight and milk production rates were calculated by linear interpolation of dry matter intake and their respective requirements for dry matter.
ResultsThe model provides an estimate of the marginal value per unit of barley fed for additional protein and the associated amino acids. Calculating the implicit value of barley at different levels of protein content, and for different weights and performance rates of the animals, provides information about the value of higher protein content in feed barley. The information helps ascertain the relationship between the optimal feed cost for beef cattle, dairy cattle, and pigs and the protein content of barley for different liveweights and performance rates. Thus, the information enables an informed assessment of whether or not there is any demand-related basis for considering protein premiums for feed barley. Moreover, the variation of relationships between different livestock weights and their performance rates is considered. In the analysis of the feed ration for dairy cattle, the protein constraint was not binding for any level of protein content in feed barley from 8 per cent to 14 per cent, although barley was always used in the least-cost rations. Consequently, the feed value of barley for dairy cows for all levels of protein was $156.2/t. This supports the opinion of many livestock feeders, particularly the dairy cattle feeders, who believe that the value of grain derives from its energy content rather than its protein content. However, protein appears to be more important to beef producers than milk producers in south east Queensland, especially for the low range of protein content from 8 to10 per cent in feed barley. Table 2 presents the implicit value of barley from the linear programming analysis of beef cattle feeding (finishing steers). The value of barley as feed peaks when the protein content is 11.4 per cent for a 300 kg bodyweight animal. The optimal protein content for a 150 kg animal was 10.4 per cent and for 200 kg body weight was 11 per cent. Compared with mean base protein levels of 11 per cent barley with a protein content of only 8 per cent is worth $10/t less for a 450 kg body weight animal and $8/t less for a 150 kg body weight animal.
Table 3: Implicit value of barley ($/t) fed to different liveweights of pig diets
* Protein constraint becomes non-binding for protein levels above this amount. Table 3 presents the results of the analysis of the implicit value of barley for pigs fed ad libitum . In the case of pigs not only protein levels but also the quality of protein is important. Husby et al. (1985) , cited in LaFrance and Watts (1986) , provided evidence that low protein barley has higher protein quality than higher protein barley. LaFrance and Watts (1986) gave the example of 8 per cent protein barley having 4 per cent lysine content in the protein, while 16 per cent protein barley may have only 3 per cent lysine content in the protein. Hence, this study considered not only different percentages of barley protein but also different lysine contents in pig nutrition to obtain the least-cost feed rations for various liveweight of pigs. Protein content in barley has considerable value in the range from 10 to 14 per cent compared with the lower protein levels. For instance, barley with a protein content of around 14 per cent has an implicit feed value around $5/t more than barley with a content of only 10 per cent. For protein content in barley above 10.2 per cent, the protein requirement becomes non-binding for all live-weights, although lysine requirement is binding throughout the range of 8 to 14 per cent protein content.
Table 4 summarizes the results across the different livestock types by presenting weighted averages of implicit prices for barley used for beef, dairy, and pig feeding in Queensland. Weighted averages were considered because the quantity of feed barley that comes into the optimal plan varies with the level of protein in barley and the type of animal fed. The quantity weights were determined as the product of the amount of barley fed in each least-cost feed ration for each animal and each liveweight, and the number of cattle on feed, number of dairy cows and number of pigs in Queensland as of 31st March 1993 (AMLC/ALFA 1994) . The weighted mean feed value of barley varies across livestock sectors as shown in Table 4. For protein contents up to 12 per cent, feeding barley with higher protein contents to steers is relatively more important than feeding barley with higher contents to pigs. Conversely feeding barley with extra protein for protein contents above 12 per cent is relatively more important for pigs than for dairy or beef cattle. Table 4: Weighted average* implicit prices of feed barley for beef, dairy and pig
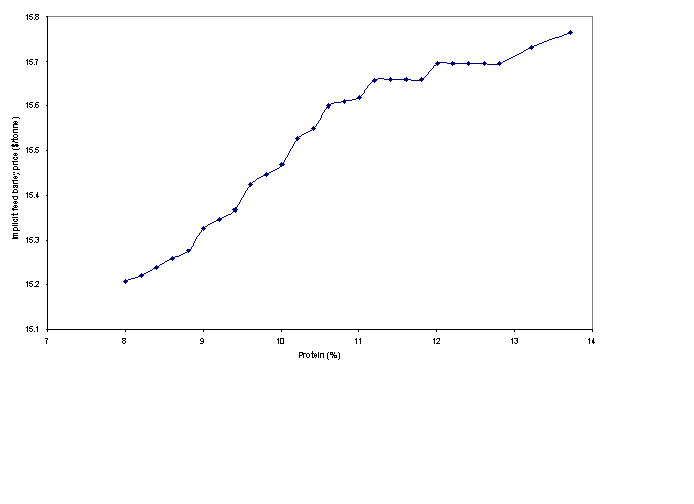
3 Weights are determined by the quantity of feed barley in the diet multiplied by the number of animals in each livestock category in Queensland on 31st March 1993. The relationship between the protein content in feed barley and its value in livestock feeding was concave as shown in Figure 1. The implicit feed values increase steadily (by approximately $5/t) from 8 to 11 per cent protein content and do not respond much after 11 per cent.
* Weighted average values over livestock types and categories. Weights were determined by the quantity of feed barley in the diet multiplied by the number of animals in each livestock category in Queensland on 31st March 1993. According to these results, the premiums for higher than normal (greater than 11 per cent) protein in feed barley do not appear to be economically acceptable. Therefore, efforts to improve market arrangements to introduce premiums for higher protein in the feed barley market would not seem to be desirable even with the present expansion of feedlots and their perceived need for quality grains. However, based on the implicit value associated with lower protein levels for various liveweights and categories of animals, there may be a case for discounting the price of feed barley with low protein levels lower than 11 per cent. Is Protein Important in Barley?The value of barley as a feed varies across livestock classes as well as within the livestock class. For different liveweights in beef cattle, the implicit value varies from $8/t to $12/t. In pig diets, the implicit value varies between $6.2 and $7.6/t. Barley with a protein content of only 8 per cent has greater implicit value for beef cattle than pigs and dairy cattle. The implicit feed value of barley is higher for heavier beef cattle, particularly at liveweights of 200 to 450 kg with average daily gain of 1.1 and 1.05 kg respectively. In pig diets, the value of barley as a feed is also higher in heavier than in young light weight animals. Hence, protein in feed barley is more important for fattening steers to higher weights, and for heavier pigs, than it is for high levels of milk production in dairy cattle. To determine whether protein is important in feed barley, the marginal value of a unit of feed barley protein in livestock nutrition needs to be compared with the implicit cost of producing that extra protein. That is, if the added costs of growing feed barley with higher protein contents exceeds the value of that extra protein in livestock nutrition, then no market for higher protein feed barley will exist. Under these circumstances, efforts to introduce a system of grades and premiums for higher protein feed barley would be flawed. Determining the implicit cost of producing extra protein in feed barley is beyond the scope of this paper. However such an analysis has been carried out in a study by Gali (1998) . Gali developed a detailed grain farm programming model for the Darling Downs involving over 280 activities and 125 constraints. The model contained all the standard elements of crop programming models such as crop rotation constraints. However, as the model was developed to address the question of whether barley growers should grow the lower yielding but possibly higher priced malting barley or grow the lower priced but higher yielding feed barley, the model contains specific activities and constraints that enable the determination of the implicit cost of producing extra protein in barley. These implicit costs were calculated for a range of seasons (production conditions) and are reproduced in Table 5 along with the marginal value of a unit of feed barley protein in livestock nutrition. Table 5: A Comparison of Implicit Values for Barley Protein ($ per 1 per cent of protein)
Source: Gali (1998) for implicit costs, and derived from Table 4 for implicit values. From Table 5 , it is evident that the implicit value of barley protein in livestock nutrition is low relative to the costs of producing that extra protein. Thus feedlotters are unlikely to use barley as the main source of protein. This highlights one of the main reasons why there is no explicit price for protein in the feed barley market. Grainco Ltd. reported protein levels in feed barley as high as 18 per cent for the 1995/96 season (Personal communication with Brad Weldon Grainco Ltd. 1996). This high protein level does not appear to have any value in animal nutrition. Therefore, it is of no advantage to the grower to concentrate on protein levels when producing feed barley. Barley growers should apply nitrogen to improve yield rather than the protein level in feed barley. Concluding RemarksOver the last two decades, Queensland's intensive livestock industries have flourished along with the supporting feed grain industries. Yet in recent times, the intensive livestock producers, in particular, but also grain growers, have experienced tough economic conditions. Faced with these adverse conditions, livestock feeders have had to be more rigorous in their selection and combination of feed inputs, while graingrowers have had to become more sophisticated in the type of grain they grow and the markets they supply. With the range of feed inputs, feed regimes, agronomic practices and varietal choices, these decisions have not been trivial for either livestock feeders or graingrowers. The study reported in this paper has sought to aid livestock feeders and graingrowers in these decisions by identifying the marginal value of additional protein content in feed barley for different liveweights and types of livestock. The results indicate, for example, that extra protein in feed barley tends to be more important for fattening steers to higher weights, and for heavier pigs, than it is for high levels of milk production in dairy cattle. The value of additional protein, however, depends on the protein content of the feed barley with little value in additional protein in finishing steers for feed barley protein contents above 11.4 per cent. Although different effects arise for different livestock and feed barley protein levels, in general, the value of additional protein in feed barley to livestock feeders is low relative to the implicit cost of producing that extra protein in feed barley. Currently the feed barley market does not discriminate between barley of different protein contents, and there has been a push to introduce a system of grading and associated premiums along the lines of the malting barley market. The results here suggest that such an investment may not be worthwhile as the underlying demand by livestock feeders for extra protein in feed barley is low, and livestock feeders will seek their required extra protein from other sources. AMLC/ALFA , (1994) National feedlot survey data , Australian Lotfeeders Association, Sydney, 1994. R.A.Bain , (1973) Factors affecting consumption and prices of the major feed grains in Australia', Quarterly Review of Agricultural Economics 26(3), pp.186-197. Gali V J , (1998), Integrated demand, supply and market analysis for Queensland barley', Ph.D. Thesis, Department of Agriculture, The University of Queensland, St Lucia, Brisbane, Australia (forthcoming). Husby F M, Calvert C C, Newman C W, Gipp W F, Harrold R L and Froseth J A, (1985), Utilization of Barley in Swine Diets. SAES Western Reg. Res. Pub. No. 4. LaFrance J T and Watts M J, (1986) The value of protein in feed barley for beef, dairy and swine feeding', Western Journal of Agricultural Economics 11(1), pp.76-81. Meyers Strategy Group (1995), Feed grains study, main report', Volume 1, commissioned by Grains Research and Development Corporation, Dairy Research and Development Corporation, Pig Research and Development Corporation, Chicken meat Research and Development Council and the Egg Industry Research and Development Council, April 1995. Minnett I, (1994) Grain end-uses for stock feed' in Australian Grains: A complete reference to Australian grain industry by Australian Wheat Board, Morescope Publishing pty Ltd. Victoria. National Research Council (NRC), (1976) Nutrient requirements for beef cattle', 5th edition, National Academy of Sciences, Washington DC. National Research Council (NRC), (1978) Nutrient requirements for Diary cattle', 5th edition, National Academy of Sciences, Washington DC. National Research Council (NRC), (1979), Nutrient requirements for Swine', 8th revised edition, National Academy of Sciences, Washington DC. Queensland Department of Primary Industries ( QDPI ), (1982), Farm Management Hand Book', QDPI, Brisbane. Queensland Department of Primary Industries (QDPI), (1994), Pig nutrition information service', QDPI, Toowoomba. Ryan T. J . and Associates, (1997) Australian feed grains: A strategic plan leading the industry into the 21st century', Strategic Planning Unit, Consultants Report. Grains Council of Australia. Thompson R, (1995), Malting barley and feed grains-future supply' National Agricultural and Resource Outlook Conference: Outlook 95 : 193-198. Australian Bureau of Agricultural and Resource Economics, Canberra. |
||||||||||||||||||||||||||||||||||||||||||||||||||||||||||||||||||||||||||||||||||||||||||||||||||||||||||||||||||||||||||||||||||||||||||||||||||||||||||||||||||||||||||||||||||||||||||||||||||||||||||||||||||||||||||||||||||||||||||||||||||||||||||||||||||||||||||||||||||||||||||||||||||||||||||||||||||||||||||||||||||||||||||||||||||||||||||||||||||||||||||||||||||||||||||||||||||||||||||||||||||||||||||||||||||||||||||||||||||||||||||||||||||||||||||||||||||||||||||||||||||||||
|
Contact the University : Disclaimer & Copyright : Privacy : Accessibility |
|
Date Created: 04 June 2005 |
The University of Melbourne ABN: 84 002 705 224 
|