|
|
|
|||

Department of Agriculture and Food Systems
|
||||
|
||||
|
|
|
|||
Department of Agriculture and Food Systems
|
||||
|
||||
|
|
Agribusiness Review - Vol. 9 - 2001Paper 6 Single Desk Selling by the NSW Grains Board: Public Benefit or Public Cost?R.J. Farquharson and G.R. Griffith Senior Economist, Tamworth, and Principal Research Scientist, Armidale, respectively, NSW Agriculture. The thoughtful comments of Geoff Edwards and Bob Lindner on an earlier draft are gratefully acknowledged. AbstractIn this paper we report an economic analysis of the activities of the NSW Grains Board over the period 1992 - 1998. This work was undertaken in conjunction with a NSW State Government review of the legislation that grants powers of vesting and single desk selling to the Board, powers that can be considered as restrictions to competition. A net public benefit test was used as the basis for the review. Economic trade theory, institutional arrangements and econometric analysis were used to conceptualise conditions necessary and sufficient for price discrimination to be present, and then estimates were made of the dimensions of the social benefits and costs associated with the price discrimination behaviour. The main results were that for sales of malting barley the Board's activities were found to deliver a net benefit to producers, but domestic prices were higher resulting in a net overall social cost. No net benefit to producers was found for feed barley or canola. Resulting from the review, a report was submitted to the NSW Minister for Agriculture in July 1999. The Government announced in August 2000 that the NSW Grains Board would continue to hold vesting powers for the next five years. Following a concurrent investigation of the Board's financial position, severe financial problems were identified and the Board acted to find an equity partner. In October 2000 the Minister announced an agreement between the NSW Grains Board and Grainco Australia Ltd of Queensland, whereby Grainco purchased exclusive export rights for barley, canola and sorghum grown in NSW and domestic vesting rights for malt barley. The Grains Board bankers were to absorb most of the accumulated losses. A Public Accounts Committee of the NSW Parliament subsequently reported on the collapse of the Board and identified a number of reasons, including a conflict between the Board structure and incentives, industry change and a high-growth strategy pursued in later years. Other operational factors also contributed. These reasons are quite separate to the net public benefit test reported in this paper. There are valuable lessons for government and corporate entities in the Public Accounts Committee Report, but the analysis presented in this paper deals with a separate issue. It casts doubt on the argument for granting monopoly powers in agricultural marketing, from a societal point of view. This potential drawback should be considered a primary objection to such schemes; the operational failings identified elsewhere are additional considerations.
1. Introduction"Ironically, the Grains Board grew from the seeds of financial calamity. All previous single-desk grain trading authorities in NSW had gone bust in spectacular style due to the inherent dangers of the market. Sudden fluctuations in grain prices tended to kill such authorities, which existed with thin capital reserves. The other difficulty was the time between buying grain and selling it could be length. But the Grains Board, created in 1991, was pitched on the basis that it would be different. It was going to survive, it was argued, because it held the monopoly right to be an exporter and it would charge its competitors in the domestic market a levy of $1.50 a tonne to buy and sell their grain locally." (Goodsir 2001, p4) It is now history that the NSW Grains Board did not survive. This paper is about whether one of the stated arguments for its survival, its monopoly right to be an exporter, was a valid one or whether the Board was always doomed to fail. The NSW Grain Marketing Act 1991 authorised vesting of certain coarse grains and oilseeds (principally malting and feed barley, and canola) in the NSW Grains Board and granted rights to single desk selling by that Board. These powers created monopsony (market with a single buyer) as well as monopoly (market with a single seller) conditions for the Board. They can be considered as restrictions to competition, and have implications for grain production, processing and end-user markets. The legislation and the associated restrictions to competition were reviewed in 1999 as part of the NSW Government's commitment to National Competition Policy in accordance with the principles set out in the Competition Principles Agreement (Council of Australian Governments 1995) and as recently described by Milham and Davenport (1999). The monopoly selling conditions are the focus of this paper. There have been a number of recent assessments of the benefits of statutory marketing authorities and single desk selling, both in Australia and overseas. Contributions to a review of legislation in Victoria and South Australia relating to the Australian Barley Board (ABB) included those by the Meyers Strategy Group (MSG) (1996) and the Centre for International Economics (CIE) (1997). The Boston Consulting Group (1995) earlier evaluated the single desk for malting barley. Carter (1993) has been one of a number of commentators on marketing issues in the Canadian grains industry. Watson (1997) noted that whereas previous reviews were often conducted from the perspective of growers (eg the MSG report on the ABB), evaluations under National Competition Policy guidelines are based on the net public benefit test that requires inclusion of other impacts. The NSW Grain Marketing Act 1991 was originally enacted to improve the marketing of coarse grains and oilseeds in NSW. While not stated explicitly the legislation was primarily aimed at improved industry performance. The guidelines for this latest review were wider, encompassing the impacts on end-users of grain. In this paper we sought to determine the net public benefits or costs from the operations of the Act, through the Board, which relied on restrictions to competition to derive benefits to producers and/or others in the relevant industries. To test in a quantitative sense the impact of the Board (and its vesting and single desk selling powers) a number of issues were addressed. These included the possible types of premiums that could be derived by an organisation such as the Board, and whether these types of premiums relate to the powers given under the Act. A set of necessary and sufficient conditions for price discrimination to be present were developed and applied to each grain type. We then assessed the economic benefits and costs arising from the restrictions to competition arising from powers given under the Act. 2. Types of Price PremiumsThere are potentially three different types of price premium that could be obtained by a seller or marketer of a product (MSG 1996): (1) competitive' price premiums, which reflect the normal pricing activities of suppliers attempting to achieve the highest possible price in a market and/or gain a sale over a competitor. This is often achieved via product attributes (apart from price) and provision of other services associated with the product. Commercial grain traders can achieve this type of premium without the benefit of single desk selling powers. For this reason, competitive price premiums (if they are achieved) are not relevant as gains within the Competition Principles Agreement guidelines; (2) market restriction' premiums, which may be generated as a result of intervention by governments in a market through use of quotas, tariffs, subsidies or taxes. An example of a market restriction premium is the Japanese market for feed barley. The premium is derived for NSW barley growers through the Board's ability to gain a share of the higher-priced quota imports allocated by the Japanese Food Authority. However this premium does not arise from restrictions to competition, but rather from the fact that the Board is a government instrumentality', therefore these premiums are also not relevant as gains within the guidelines; and (3) price discrimination' premiums, resulting from the ability of a supplier to price discriminate by customer, by place or over time. The ability to price discriminate between markets (or price to market') is dependent on the existence of some market power. Vesting and single desk arrangements are commonly associated with market power and price discrimination premiums. The justification for maintenance of powers under the Act would be if those powers were used to generate a net benefit to NSW society. Those powers could only generate benefits if they were used in a price discrimination context. Therefore the analysis in this paper focuses on price discrimination and the measurement of the impact of potential price discrimination premiums. 3. Theory of Price DiscriminationIn a competitive market, price is determined by the interaction of aggregate supply and aggregate demand, and the same price is charged to different customers after accounting for transport, storage and other costs. Nothing the individual firm does can influence the price it receives for its product, so each firm is a price taker'. In an imperfect market characterised by price discrimination, the firm is large enough to exert some market power, and quantities can be allocated across markets so that different prices are charged to different customers after accounting for the costs of transportation. There are two critical assumptions underlying the ability to price discriminate across markets. First, markets must be separated in space, time, form or some other dimension, and this separation must be able to be maintained so that there is no possibility of arbitrage across different markets. Second, there must be different demand relations (price elasticities) in the markets so that the relationship between prices and marginal revenues vary between markets. If these two assumptions hold, then a supplier with market power can increase revenue by restricting supplies in one market and transferring the residue into a second market. Because the demand relations differ between markets, equating marginal revenues means that different prices are received in the different markets. Prices are higher in those markets where the exporter faces relatively inelastic demand. So a supplier, such as a central selling agency with market power, may be able to achieve price premiums in some markets, which are sufficient to increase overall returns to the industry. In theory a rule can be used to maximise profit to the supplier under this arrangement. For malting barley, the major export markets are separated by long distances and these markets may have different price elasticities of demand, reflecting unique product attributes. Within the NSW domestic market, the Board operates as a single desk seller of NSW malting barley so that arbitrage possibilities within that market are limited for interstate product. It should be noted that prices may differ across markets for reasons other than market power, such as differences in quality, other services bundled with the product such as credit or quality assurances, or differences in transport costs. When attempting to measure the extent of market power premiums, the product being compared should be as similarly defined as possible in each of the markets being studied. 4. Conditions Necessary for Price DiscriminationIn this and the next section we examine evidence to determine whether the Board has been able to price discriminate. Based on theory and the institutional arrangements, we first consider whether there are likely to be conditions necessary for price discrimination. Then in Section 5 a comparison of prices between markets allows a determination of whether price discrimination is likely to have been achieved. We found that, for malting barley, price differences between markets are of sufficient size and sign to warrant further evaluation under a net public benefit test. The necessary conditions for evidence of price discrimination relate to differences in demand elasticities faced by exporters between markets and the ability of a marketer to separate markets and control the flow of product onto at least one of the markets. In general the degree of market power determines whether a seller into a market is able to raise the price received above the marginal cost of production. If so, and if the seller has a significant market share, then gaining price premiums may be possible. Differences in demand elasticities between marketsThe market price responsiveness faced by exporters may differ between markets due to a number of factors. In a competitive market the actions of the particular seller have no impact on the price received, the price is given and demand is said to be perfectly elastic. In a market where the actions of a seller have a significant impact on price, demand is said to be price-responsive and slopes down when plotted in price-quantity space (shown in Figure 1). The degree of quantity-responsiveness to a small change in price (or elasticity) is important in terms of total revenue from changes in sales volumes. Figure 1
The concept of market power is based on the idea that when making output decisions (quantity produced and/or sold), firms form beliefs about the extent to which their decisions affect the quantity decisions of other firms, and therefore the overall industry price. So: · if the price in a particular market depends on the quantity sold into that market (ie, demand slopes down); and · if the seller has a relatively significant market share; then the theory set out in standard microeconomics texts such as Frank (2000) explains that the (dominant) seller can achieve a higher price (over and above its marginal costs) because of its market power. In technical terms, the necessary conditions for efficient allocation in this case comes down to equation (1):
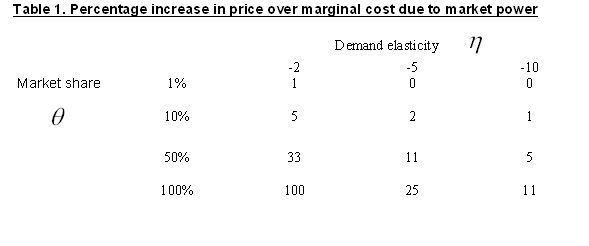
If q is zero or insignificant, then P = MC which is the competitive market outcome for the individual firm. If the market share is 25 per cent and the demand elasticity is -10, then (1) shows that the price is raised by nearly 3 per cent above marginal cost due to market power. The potential size of the increase in price as market power and demand elasticity vary is shown in Table 1. The possibility of price enhancement varies directly with market share but inversely with demand elasticity. |
| lnPit = c + SαiDi + SуtTt + SßilnXit + uit | (2) |
| where | |
| lnPit | = natural log of the FOB equivalent price of the relevant grain to market i (domestic market or separate export destination) at time t in Australian dollars net of transport costs |
| Di | = dummy variables to capture the market or country effect |
| Tt | = annual dummy variables to capture the common time effect |
| lnXit | = natural log of the exchange rate between country i and Australia at time t |
| c | = constant term for the base market and time period |
| uit | = error term |
The data were for a seven-year period, and because prices trend up and down with changes in market conditions over time, year effects were removed before the market price comparisons were made. This was achieved by the use of dummy variables in the above regression equation, which effectively separated the year (or time) effects from the country effects in explaining prices achieved by the Board. This enabled comparison of prices of the subject commodities at different points in time. A potential problem with the analysis was that due to substantial price volatility over time, the use of an annual time step could still mask time effects in the analysis. This problem could not be avoided, however, as there were insufficient data to maintain adequate degrees of freedom using a more frequent time period.
Therefore the model used in the analysis tested whether the FOB price ($AUS) of the commodity was influenced by any particular market, year or exchange rate effects, using statistical techniques.
The maintained hypothesis was of a single competitive market for the sales of the given commodity by the Board. After accounting for the common level of price that would be achieved in each period by market factors, this implies that price equals marginal cost and prices are equalised across markets.
The alternative hypothesis is of an imperfect market involving price discrimination. If some of the individual market influences are not zero, and the price is higher in the less elastic market, then price discrimination could occur and price premiums could be obtained.
The statistical results are presented in NSW Government Review Group (1999), and are summarised here. Note that since the data were provided to the Review Group on the basis of confidentiality, the Group decided that actual coefficient estimates could not be reported.
The Board sold malting barley mainly to the Domestic and Chinese markets, with the number of sales to other markets being very low. Results of the analysis indicated that there was a statistically significant price difference between prices the Board received in the Chinese and Domestic markets, with the price in the latter being higher. This implies the possibility of price discrimination being achieved. The available data were insufficient to categorically determine whether or not the Board could discriminate between different export markets. This result was after the effects of year of sale (which were quite significant in most years) were accounted for. However, exchange rate effects were not significant in this analysis. This is of concern because the ability to adjust FOB prices in response to changes in exchange rates is a stronger test of the ability to price discriminate than differences in average prices between markets.
The Board's sales of feed barley were classified into three main markets - Domestic, Japan and Other. Overall, the analysis did not provide evidence of statistically significant price differences between these markets. There was evidence of significant year effects and the Japanese and Chinese exchange rates were also significant, however there was no demonstrated market effect.
There are three major markets for the Board's sales of canola - Domestic, Japan and China, although sales to China are relatively low in number and volume. There have been a small number of sales to other international markets. The results of the statistical analysis were that there is some evidence of a price effect in the Japanese and Other markets compared to the Domestic market with the latter being significantly lower than those in other markets over the period. The year effects were also significant, as were the exchange rate effects for the three currencies tested. The general explanatory power of this estimated equation was, however, very low indicating that other factors, which have not been accounted for, may explain the level of canola prices. For example, the canola industry worldwide has seen remarkable growth in recent years, with demand being particularly strong in countries such as Japan because of increasing health consciousness and awareness. Demand growth in export markets at a greater rate than in the domestic market could explain the price relativities.
The overall outcome from the statistical analysis was that there was strong evidence of price differences across malting barley markets from the Board's selling activities (Domestic higher than China). For feed barley and canola the results were less robust, so no firm conclusions could be drawn.
When combined with the conditions considered necessary for price discrimination (ie, differences in demand elasticities and the ability to control the Domestic (NSW) market via single desk selling) this result indicated that price discrimination may be occurring for malting barley. In relation to this commodity, the next step was therefore to measure the costs and benefits to affected parties.
For malting barley we have seen that the Board had the capacity to price discriminate. Further the analysis suggested that the observed prices were statistically different between markets, with the more inelastic Domestic market having higher prices than in the export market.
The existing price and quantity information in each market was the starting point for the analysis of benefits and costs of the arrangements. We needed to estimate the prices and quantities that would have occurred in each market, if price discrimination were not practised, ie if the law of one price prevailed. With this information the producer revenues and consumer/end-user impacts of removing the competition restriction could be valued. The methodology developed by the CIE (1997) was used to make these calculations.
A number of assumptions need to be made in this process (CIE 1997, Appendix D):
· price differences observed in different markets reflect differences in the demand characteristics of those markets, ie, they reflect differences in the demand functions of these markets;
· these demand functions take the form of equation (3):
| Di = αi Pi βi | (3) |
| Where | |
| Di | is the quantity demanded in market i |
| Pi | is the price in market i |
| ai | is a scaling parameter, and |
| bi | is the elasticity of demand in market i (a negative number) |
· the single desk seller takes advantage of these differences in price responsiveness and optimises the returns from a given crop by controlling sales (and therefore prices) to a given market; and
· price differences across markets as a result of this optimising behaviour of a single desk seller are as shown in equation (4):
| |
(4) |
Here i and j represent any two markets and bj is the elasticity of demand in market j. This implies that relatively higher prices should be charged where demand is relatively more inelastic. This condition further implies that the Board is maximising returns to growers.
Using the Board's confidential information provided on prices and quantities sold in various markets (and averaging the price and quantity data over the seven years 1992-1998), this condition permits the calculation of the demand elasticities. Initially calibrating the model by setting b1 at a level consistent with expectations and evidence, condition (4) can be used to estimate b2 .
Then the other b's can be calculated, and using (3) the a's can be calculated from average price and quantity figures derived from the Board's data. In choosing b1, the value that maximises the premium defined above is searched for iteratively.
In the absence of a single desk seller there will be one competitive price ( Pc ) for the products sold. This can be found using the demand functions specified in (3) by solving:
| Σi (αiΡcβi) = Q | (5) |
Here Q is the total supply of malting barley. This equation is solved using an iterative procedure.
The difference between Pc and the average return (SiSi.Pi) / Q , where Si is sales to market i, represents a per tonne gain to producers from single desk selling arrangements.
While the premium determined here represents a gain to producers, its effect on consumers or end-users must also be considered. Restriction of supply to the domestic (more inelastic) market means that the domestic price Pd is higher than the competitive price Pc
This loss is calculated as the area under the demand curve between the two prices and represents the consumer surplus loss due to single desk selling arrangements, and is illustrated in Figure 1.
The observed prices under the current (price discrimination) arrangements are Pd and Pe .
Using assumptions about the demand elasticities in each market and equation (4), the equilibrium price Pc was then calculated.
The effects of price discrimination (compared to no-restrictions-to-competition) can be seen from Figure 1. In the domestic market, producers gain the area shown, which results from a higher unit price for the quantity sold. This quantity Qd is less than it would be under the no restriction scenario Qcd .
Producers lose the area indicated, this being the amount transferred to the export market at the no-restriction-to-competition price. Consumers lose their willingness-to-pay (as shown by the demand curve) which is the area under the demand curve between the two prices ( Pd and Pc)
On the export market, the areas of interest to NSW are the producer loss (horizontal area, representing the price discount on the competitive equilibrium quantity) and the producer gain (representing more sold at the lower price). Adding up all these areas gives a net gain or loss to NSW society, which accounts for impacts on both producers and end-users/consumers.
Equations in (3), (4) and (5), together with observed average prices ( Pd , Pe).
Because of the assumptions used in the equations, and the averaged nature of the price and quantity figures, the results cannot be considered to be exact or precise in a statistical sense. In discussing these results, it therefore must be remembered that it is the orders of magnitude and the signs of the aggregate effects that are most important, rather than the absolute values estimated. A number of sensitivity analyses have been conducted and these are also important in interpreting the results.
The economic analysis of price discrimination in malting barley has shown that the operations of the Board have delivered a small net benefit to producers. Compared to the situation of restrictions to competition granted under legislation, there would be gains on export markets and losses on domestic markets from changes in quantities that would prevail if there were no restrictions to competition.
The analysis shows that the Board price discriminated between domestic and export markets and, as a result, prices on the domestic market were higher. This means that processors of malting barley paid a higher price, resulting in a net cost to them.
An example of the results is shown below for an initial demand elasticity in China of -10 (which was the value quoted in Appendix 3 of the MSG (1996) report):
|
Net gain to producers |
$0.206 million per annum |
|
Processor (consumer) loss |
$1.235 million per annum |
|
Net cost |
$1.029 million per annum |
The result above was based on the assumption that the Board knows the values of export demand elasticities and uses that knowledge to maximise returns to growers. Two cases for sensitivity analysis were conducted. The first involved removing the assumed perfect knowledge of demand elasticities while still maintaining the optimising condition. The second involved removing both the assumptions of perfect knowledge of demand elasticities and of maximising behaviour.
To test the effect of varying the demand elasticity in the Chinese market, an analysis of the above result was conducted for different levels of initial Chinese demand elasticity, between the values of -1.2 and -20. Over this range the estimated price premium, the overall producer gain and the consumer loss all varied, however, the overall net loss was very stable - changing from only $1.028 to $1.034 million per annum.
A test was also conducted of the impact on net costs/benefits of assuming that the Board was a price taker (ie, facing an infinite demand elasticity) on the world market (ie, if Pc equals Pe in Figure 1). Under this scenario, which may more closely reflect global market conditions, gains to NSW producers rise to approximately $1.01 million, which is a direct transfer from purchasers, and the net social loss reduces to a very small amount (estimated at about $22,000 per annum).
The other area of investigation of the sensitivity of the results involved relaxing condition (4). This implies that the Board does not know the size of demand elasticities in markets and, further that it does not know the relationships between elasticities and prices in order to be able to maximise revenues from price discrimination.
The @RISK (Palisade Corporation 1995) program was used to conduct this analysis. The demand elasticities in the export and domestic markets were varied according to a uniform distribution with bounds of -10 and -1. The simulations were performed for 1,000 iterations and the results compiled into a probability distribution function. This is presented in Figure 2.
FIGURE 2
Through this analysis, the estimated single point net gain to NSW discussed above (a loss of $1.029 million per annum) is shown to lie in a distribution of possible outcomes ranging from -$2.066 million to -$341,000 per annum. This result suggests that the Board is unlikely to ever gain a net (positive) benefit for the NSW economy as a whole from price discrimination in malting barley markets.
A number of points can be made about these results. First, they are illustrative and should be interpreted as indicating broad measures of costs and benefits.
Second, they are initially derived assuming the equilibrium condition (4) holds, which implies that the Board has perfect knowledge of demand elasticities in different markets. Because of the uncertain and changing nature of international markets it is unlikely that this condition holds very often, if ever! In this case, the benefits and costs estimated from the equilibrium condition are likely to overestimate the size of any benefits to producers. A sensitivity analysis of relaxing condition (4) using risk analysis showed that the range of public benefit outcomes is not likely to ever include a net public benefit.
Third, the processor cost incorporates the value of services (eg, storage, delivery) provided by the Board as well as market power premiums. There are other factors that could be counted in evaluating this figure, including price and quality risk management. In other words, there may be a number of services provided by the Board which are included in the price paid by the processors that are not provided to buyers on the export market. If this is the case, then the assumption underlying the analysis, ie, that the same commodity is sold on each market, might not be fully met. If so, then the price paid by processors ( Pd ) is likely to be higher than the price for a product sold on the export market. Therefore the losses to end-users/consumers identified in this analysis may be overstated. Whether this qualification could lead to an overall net social gain is doubtful, since the extra costs of transforming the product would need to be included.
Fourth, this net cost at the first point of consumption from the Board's activity represents less than one per cent of the value of the malting barley crop in 1996/97. Therefore the size of the net cost identified is not large in a relative sense.
This analysis has attempted to lay out the basis for assessing gains from restrictions to competition contained in the NSW Grain Marketing Act 1991, and to derive some broad indications of the costs and benefits to the various parties affected by the operations of the NSW Grains Board.
The analysis of price differences indicated that malting barley prices on the domestic market were higher than on export markets, suggesting the possibility of price discrimination.
Price discrimination provides net benefits to producers by increasing the overall returns from selling into the different markets. In part, these benefits are derived from increased export sales, and in part by extracting transfers from domestic purchasers of their commodity through higher domestic prices. Increased export returns are a benefit to the NSW economy for the purposes of a net public benefit test. Transfers between producers and purchasers (eg, processors) do not, however, represent a gain or loss to the economy as a whole and hence do not count in this test.
Price discrimination also gives rise to resource allocation inefficiency costs represented as losses to domestic purchasers, which are not transferred to producers. These dead weight' losses are counted as costs in the net public benefit test.
Using the theoretical relationship between prices and demand elasticities for maximising returns to producers, an upper bound for the net costs to society (about $1 million per annum) was estimated. This is an estimate of the cost to the NSW economy as a whole from providing benefits to NSW malting barley growers (estimated at $0.2 million per annum) through the domestic and export single desk power granted under the Act and utilised by the Board.
Under an alternative, and perhaps more realistic scenario, while there were still significant transfers from domestic purchasers to producers (estimated at $1 million per year), estimated annual net losses to the NSW economy from the combined single desk arrangement, were found to be much lower.
This analysis has investigated the value of one important activity of a single desk price discrimination to an industry. It has not considered the earning of price premiums by means other than price discrimination in export markets. There may be these types of benefits to the grains industry from having a single desk, but they have not been quantified here.
Resulting from the government review of the NSW Grains Board, a report was submitted to the NSW Minister for Agriculture in July 1999. The Government announced in August 2000 that the Grains Board would continue to hold vesting powers for the next five years. Following an investigation of the Board's financial position, severe financial problems were identified and the Board acted to find an equity partner. In October 2000 the Minister announced an agreement between the NSW Grains Board and Grainco Australia Ltd of Queensland whereby Grainco purchased exclusive export rights for barley, canola and sorghum grown in NSW and domestic vesting rights for malt barley. The Grains Board bankers were to absorb most of the accumulated losses.
A Public Accounts Committee of the NSW Parliament subsequently reported on the collapse of the Board and identified a number of reasons, including a conflict between the Board structure and incentives, industry change and a high-growth strategy pursued in later years. Other operational factors also contributed. These reasons are quite separate to the net public benefit test reported in this paper. There are valuable lessons for government and corporate entities in the Public Accounts Committee Report, but the analysis presented in this paper deals with a separate issue. It casts doubt on this case of granting and use of monopoly powers in agricultural marketing from a societal point of view. This potential drawback can be considered a primary objection to such schemes; the operational failings identified elsewhere are additional considerations.
Nevertheless, the two issues are linked together, as shown in the following quote: " . the battle against deregulation was one of the factors that led to poor decisions and large losses, (an industry insider) said. A strong motivating factor for the NSW Grains Board to increase its turnover of grain (and to become involved in a series of disastrous financial transactions) was in fact to demonstrate its importance to the industry when it was reviewed under National Competition Policy guidelines." (Wyatt and Allen 2000, p3). An interesting question for policymakers is whether the operational failings described in the Public Accounts Committee Report would have arisen if there had not been the single-desk regulatory structure to defend?
Boston Consulting Group (1995), Malting Barley, Consultant's Report to Grains Council of Australia Strategic Planning Unit.
Carter, Colin A. (1993), The Economics of a Single North American Barley Market', Canadian Journal of Agricultural Economics 41: 243-255.
Centre for International Economics (1997), Review of the Victorian and South Australian Barley Marketing Act 1993: Under the National Competition Policy Review Legislative Restrictions on Competition, Canberra.
Council of Australian Governments (1995), Competition Principles Agreement, Memorandum between Governments, Canberra.
Frank, R.H. (2000), Microeconomics, Fourth Edition, International Edition, Irwin McGraw Hill, New York.
Goodsir, D. (2001), "Bad seed" [Online]. Available: http://www.smh.com.au/news/0104/02/features/features1.html [2001, 2 April].
Griffith, G.R., J.D. Mullen, M. Fagan and R. Jones (1995), Can the Ricegrowers Cooperative Price to Market in Australian rice export markets?', Confidential Draft, Economic Services Unit, NSW Agriculture, 16 October.
Meyers Strategy Group (1996), Economic Analysis of the Value of the Single Desk, Confidential Report to the Australian Barley Board, Sydney, April.
Milham, N. and S. Davenport (1999), Plant and Animal Health Regulation: Some Competition Policy Issues', Agribusiness Perspectives, Paper 19. Available on line at: http://www.agrifood.info/perspectives/1998/Milham.html
NSW Government Review Group (1999), Review of the NSW Grain Marketing Act 1991: Final Report, The Government of New South Wales, Orange.
Palisade Corporation (1995), '@RISK: Risk analysis and modelling for the PC', New York.
Watson, A.S. (1997), 'The "Meyers Report" & The Australian Barley Board', Agribusiness Perspectives, Paper 4. Available on line at: http://www.agrifood.info/perspectives/1998/Watson.html
Wyatt, S. and L. Allen (2000), "NSW Grains Board losses top $8.5m", [Online]. Available: http://www.afr.com.au/news/20000728/A34723-2000Jul27.html [2000, 28 July].
|
Contact the University : Disclaimer & Copyright : Privacy : Accessibility |
|
Date Created: 04 June 2005 |
The University of Melbourne ABN: 84 002 705 224 
|