Australasian Agribusiness Review - Vol.18 - 2010
Paper 11
ISSN 1442-6951
Weather and Wether: effects of wind, temperature and rain on sheep feedlot production [1]
J. M. Pluske, A.M. Slade and P.E. Vercoe
J.M. Pluske, SciEcons Consulting, PO Box 1604, Subiaco, 6904, Western Australia
A.M. Slade, Mount Baker, Western Australia
P.E. Vercoe, School of Animal Biology, The University of Western Australia, 35 Stirling Hwy, WA, 6009, Australia;
Corresponding author, J.M. Pluske, email: jpluske@westnet.com.au
-------------------------------------------------------------------------------------------------------------------------
Abstract
Thermal stress caused by extreme temperatures, wind and rain, negatively affects profitability of sheep production due to increased maintenance requirements causing a reduction in weight gain and the efficiency of feed utilisation. The purpose of this paper was to explore the capacity of a bioeconomic model to evaluate biological and economic implications of thermal stress on feedlot lamb production. It was expected that strategies aimed at reducing thermal stress of lambs would lead to improvements in growth rates and feed conversion efficiency, and subsequent economic net benefits. The findings from the model indicated that reducing thermal stress on the lamb all had positive effects on growth rates. Treatments involving shelter and increased fleece length reduced the energy needed to maintain a constant body temperature leading to higher energy availability for growth. Simulating near ideal environmental conditions by providing shelter in the feedlot and having fleece length at 40 mm enabled an almost constant growth rate throughout the year indicating that thermal stress was almost completely alleviated. Based on the assumptions used for this paper and depending on fleece length, it would be rational for a producer with an annual turnover of 5,000 feedlot sheep to spend between $29,000 and $53,000 on a shelter. Being a simulation model, there are an infinite number of assumptions that could be made to derive results and hence the results presented in this paper provide examples of those that can be generated by the model. While results from the model showed that environmental factors affect lamb production in accordance with the literature, further model development would be useful as additional biological equations become available.
Key words: Bioeconomic modelling, thermal stress, sheep, feedlot.
1. Introduction
Thermal stress occurs either side of the thermoneutral zone, defined as the zone where the effort required to regulate body heat is lowest and thus maintenance requirements are minimal (Yousef 1985). When animals are outside their thermoneutral zone, more energy is used to regulate body temperature leaving less energy available for growth. This zone is primarily affected by the level of nutrition, age, degree of acclimatization and fleece characteristics that can shield the lamb from environmental factors (Yousef 1985).
The upper limit of the thermoneutral zone is defined by the upper critical temperature and is characterised by an increase in maintenance requirements and decreasing voluntary food intake (Silanikove 1992). This increase in maintenance requirements is the result of a dependence on heat loss through evaporative means, such as sweating, and evaporative respiration as the effectiveness of non-sensible means[2] is reduced with rising ambient temperatures (West 2003). Voluntary feed intake is reduced so that heat production resulting from metabolic processes is decreased (Denek et al. 2006). Tissue anabolism (creation of new tissue) is decreased because the intake of essential nutrients required for tissue synthesis is reduced (Christopherson and Kennedy 1983), and tissue catabolism (tissue break down mainly from fat deposits and lean body mass) increases to meet the animal’s energy demand (Marai et al. 2007). The result is a decrease in lamb productivity.
The lower limit of the thermoneutral zone is defined by the lower critical temperature and is characterized by an increase in maintenance requirements and voluntary feed intake (Ames and Ray 1983). In order to maintain body temperature, substrate is used for heat production that is either supplied from increased feed intake or increased protein catabolism and amino acid mobilization (Yousef and Johnson 1967). As explained by Young (1983), the energy available to the lamb is also diminished because the digestibility of the feed is lower due to the increased rate of passage of digesta caused by the higher feed intake. Thus a reduction in growth rate is expected in response to cold stress because the lower digestibility of feed and increased maintenance requirements to maintain homeostasis reduces feed conversion efficiency (Ames and Brink 1977).
There are models that incorporate animal growth rate and economic implications of management strategies. In a model described by Alford et al. (2006), estimates of production targets such as livestock growth rates that might be reasonably achieved for a sheep enterprise were used to generate output. There was the capacity to alter animal growth rates in this model, but they were not linked to biological or environmental parameters. As another example, Duddy et al. (2007) described the ‘Lamb Feedlot Calculator’ that links diet to growth rate. However, biological effects associated with weather or shearing are not evident in this model.
Although it is expected that thermal stress in feedlot sheep would have negative economic consequences for a producer, there is a lack of literature connecting the biological implications of this stress with the economic consequences. H2OSheep is an example of a bioeconomic model that was used to determine the economic implications of water price and use in commercial feedlots (Pluske and Schlink 2008). In this study we extend the H2OSheep model to include biological and economic factors associated with thermal stress.
The purpose of this paper is to explore the capacity of a bioeconomic model to evaluate biological and economic implications of thermal stress on feedlot lamb production. It is expected that management strategies aimed at reducing thermal stress of lambs will lead to improvements in growth rates and feed conversion efficiency, and subsequent economic net benefits.
The bioeconomic model and application are described in the proceeding section followed by some results simulated as examples of what the model can generate. Discussion of these results is also presented in this section followed by conclusions in the final section.
2. Methodology
2.1 The Model
The bioeconomic model used in this paper was written in Microsoft Excel®. Environmental factors influence digestibility of feed, maintenance requirements, dry matter intake and ability to regulate heat, all of which impact on the growth rate and feed conversion efficiency of lambs. Parameters pertaining to the environment (average monthly 9 am and 3 pm temperature and wind-speed estimates as well as monthly rainfall values) and fleece length were added to the H2OSheep model to generate growth rates, feed conversion ratios and subsequent economic results.
In the literature, biological equations suitable for this model were scarce and hence the model was limited by what was available. Live weight gain was based on formulae provided by AFRC (1993). These formulae were integrated with those provided by SCARM (1990) for metabolisable energy at maintenance and those derived by Ames and Brink (1977) for feed intake and digestibility (see Appendix 2 for addition biological equations to those presented in this section).
2.1.1 Live weight gain
As explained in AFRC (1993), predicted live weight gain is dependant upon the metabolisable energy required for maintenance, the metabolisable energy of the feed and dry matter intake. The metabolisable energy retained by the animal as body tissue is a function of dry matter intake, metabolisable energy of the feed, metabolisable energy required for maintenance and the efficiency of use of metabolisable energy for growth.
2.1.2 Maintenance requirements
Energy required for maintenance is influenced by environmental factors and the characteristics of the fleece and its insulation properties. Metabolisable energy at maintenance is described in SCARM (1990) as the amount of energy required at maintenance being a function of body weight, age, efficiency of energy utilisation, the additional energy needed for cold stress (when below the lower critical temperature) and energy used for grazing, assumed to be zero under lot-feeding conditions.
The additional energy needed when the animal is cold stressed is dependent on ambient temperature, as well as surface area of the lamb, tissue insulation, external insulation and the lamb’s lower critical temperature. The lower critical temperature is a function of body temperature, evaporative loss, surface area, external insulation, heat loss, tissue insulation, rainfall and fleece length and can be found by rearranging equations in SCARM (1990). External insulation is dependent on wind velocity, thermal insulation of the fleece, fleece length and the radius of the animal. Heat loss is dependent upon surface temperature, body temperature and the surface area and body insulation of the animal.
2.1.3 Voluntary feed intake
A major determinant of voluntary feed intake is temperature, with maintenance requirements increasing in response to thermal stress (Ames and Ray 1983). The relationship between fresh feed intake (FT), (percentage consumption per unit of metabolic size), and ambient temperature (Ta) was described in a regression equation by Ames and Brink (1977):
![]() (1)
(1)
To calculate change in fresh feed intake, it was assumed that 17.5°C was the standard ambient temperature and feed intake was 100% at this temperature (in line with findings from Ames and Brink 1977). The change was then calculated as the percentage of feed intake at the new ambient temperature (Fb) minus the percentage of feed intake at the standard ambient temperature (Fa). The correction factor for the temperature effect on fresh feed intake for each feed component (Fi) was then:
![]() (2)
(2)
More than 50 different feed components are specified in the model and there is capacity for additional components to be included if they are not already listed as a feed option. Up to eight components can be selected for a ration. For each, the percentage that makes up the total weight of feed supplied per head per day is a required input so that the model is able to calculate daily dry matter intake and live weight gain. The feed conversion ratio can then be simply calculated as the unit feed intake per unit weight gain.
2.1.4 Digestibility
Primarily due to a reduction in the rate of passage through the digestive system and a reduction in feed intake, as the ambient temperature surrounding the animal increases, the percentage digestibility (dT) of feed also increases (Ames and Brink 1977):
![]() (3)
(3)
In this model
it was assumed that 17.5°C was the standard ambient temperature (temperature
where the percentage feed intake is 100) and the digestibility at this
temperature was used as the base percentage digestible (![]() ) with the percentage
digestible at the new ambient temperature being
) with the percentage
digestible at the new ambient temperature being![]() . The correction for the
temperature effect on the metabolisable energy for each feed component (
. The correction for the
temperature effect on the metabolisable energy for each feed component (![]() ) would
then be:
) would
then be:
![]() (4)
(4)
Note: this
assumes that the change in digestibility, for each feed component was equal and
that gross energy for each feed component (![]() ) was not
affected by temperature and hence:
) was not
affected by temperature and hence:
![]() (5)
(5)
The net present value, in Australian dollars, is the sum of the net benefits (B) for each year (t), discounted using a discount rate (r) to calculate the net present value (NPV) (Robison and Barry 1996). Any initial investment costs (I) were also included in the calculation.
![]() (6)
(6)
The preferred strategy has the highest NPV.
2.2 Application
For this paper, climate data from the West Australian wheat-belt town of Kellerberrin (-31.62 S, 117.72 E) and recorded by BOM (2008) were used to simulate the variations that occur in environmental conditions (See Appendix 1 for data).
The model was based on a feedlot with an annual turnover of 5,000 head where lambs entered the feedlot at 35 kg live weight and, as recommended by Seymour (2000), finished after 35 days. With a rest period of 1 day between lots, a total of ten lots of 500 lambs were put through the feedlot, beginning on 1st January and ending on 26th December. For each lot of 500 lambs that entered the feedlot, it was assumed that 5% would not finish and there would be an additional 1% mortality. Based on this information, the number of sheep in the feedlot for each month of the year and sale weight was calculated in the model.
Kirby and Beretta (2004) and Wiese et al. (2003) explained that grain feeding systems and subsequent sheep growth rates vary widely in the feedlot. Several comprehensive guides that detail feedlot management are available (Kirby and Beretta 2004; Duddy et al. 2007). After considering information concerning diets the ration used to generate results for this paper consisted of 25% wheat grain; 15% barley grain; 15% lupins; 20% oat grain; 5% silage; 15% hay (50% DMD) 4.5% lucerne hay and 0.5% minerals and vitamins. For simplicity, it was assumed in this paper that one ration was used for the total time lambs were in the feedlot. At standard ambient temperature feed intake was 1.8 kg per head[3].
The average monthly price for heavy trade lambs received at the Midland sale yards was collated from successive editions of the Farm Weekly[4] and was used as the price that would be received for lambs at slaughter. This was found to vary from a high of $3.50/kg dressed in August to a low of $2.65/kg[5] dressed in October (Figure 1). Adding to this volatility in prices was the variation that occurred between years where the average standard error was found to be $0.15/kg dressed (Figure 1). It was assumed that lambs were purchased at a standard price of 65%[6] of the average prices illustrated in Figure 1.
Figure 1. Average lamb price (±se) received, on a monthly basis, for lambs sold at the Midland saleyards from 2004 to 2007.
Cost, revenue and biological data was obtained from the literature and/or industry sources. Specific feed costs are variable depending on market conditions and the ration price varies depending on diet components. Using various industry sources for each feed component, the feed cost was found to be $0.26 per head per day. This is in line with an example used in Duddy et al. (2007) where the ration cost $0.27 per head per day.
All economic calculations were conducted over a ten year period and the discount rate was set at 7%. For the gross margin analysis it was assumed that sheep were bought at a set wool length and hence revenue and costs associated with wool were not included in the analysis[7]. The actual decreasing value of the assets (depreciation) is incorporated in the model by including the purchase price and sale price at the end of an asset’s life.
Five different treatments were tested with the model, these being standard, shelter, fleece length, a combination of shelter and fleece length and purchase price. For simplicity, in this paper it was assumed that each treatment was the same for each of the ten years. However, the model has facility to make changes in biological parameters throughout any one year and in economic parameters between years.
For this treatment, lambs were shorn and not protected from the wind, rain or radiant heat. Duddy et al. (2007) suggested that lambs should be shorn two or more weeks before lot feeding and should have at least six weeks of wool to obtain a reasonable skin price. Hofmeyer et al. (1969) provided fleece length estimates as being, closely shorn (1-2 mm), medium-shorn (l0-20 mm), and unshorn (80-100 mm). Based on this literature, it was assumed in our analyses that fleece length for the standard treatment was 15 mm.
Steadman (1994) noted that apparent temperature (designed to measure thermal sensation in indoor conditions) does not include the effects of the sun. Under Australian conditions the effect of full sun produces a maximum increase in the apparent temperature of about 8°C when the sun is at its highest elevation in the sky. Recorded temperature readings are taken in the shade (BOM 2008) and hence it would be expected that temperatures in non-shaded areas would be greater than the recorded average temperature. Allowing for cloudy days, in this analysis an average of 4°C was added to the average temperature at 3 pm, for each month of the year.
By establishing shelter in the feedlot, sheep were assumed to be protected from radiant heat, rainfall and wind. Wind speed was reduced to 10% of that modelled in the standard treatment, rainfall was eliminated from biological calculations and the temperature was reduced to that recorded by BOM (2008) in the shade. Fleece length for this treatment was kept at 15 mm. The cost of shelters is dependant on several specifications. Hence, for simplicity, this analysis accounted for the benefits of improved environmental conditions and found the cost of the shelters when the NPV was the same as the standard treatment. This would equate to the maximum cost a rational producer would pay for shelters given the assumptions in the model.
Analyses were run with fleece length at 5 mm, 20 mm and 40 mm to determine the change in the animal’s ability to cope with environmental conditions given different shearing strategies.
A combination of the shelter and fleece length (40 mm) treatments was modelled to determine if this treatment was equivalent to ideal conditions for sheep production. In addition, a combination of the shelter and fleece length (5 mm) treatments was modelled to determine the benefits of providing shelter to newly shorn lambs.
2.2.6 Lamb price
It was expected that both purchase and sale price for lambs would have a significant effect on the net benefits generated in this model. To illustrate just one example of this effect, a simple gross margin analysis was conducted and included revenue from sheep sales minus costs of the store sheep and feed costs with the purchase price for lambs in August[8] of each year. Using the standard treatment, the purchase price for lambs in August was increased by $0.30/kg. In addition, the implications of shutting the feedlot down for one month of the year, in this case, August was also demonstrated in the analysis.
3. Results and discussion
3.1 Biological results
3.1.1 Growth rate
Treatments involving shelter and increased fleece length reduced the energy needed to maintain a constant body temperature leading to higher energy availability for growth. Employing the shelter, fleece length and combination treatments increased lamb growth rates for every month of the year when compared to the standard treatment, except when the fleece length was set at 5 mm (Figure 2). Overall, lambs modelled with the combination treatment had the highest year round growth rate, peaking at 365 g/day in April and November. Growth rate for the standard and wool at 20 mm treatments were similar from November through to March as were rates for the shelter and wool at 40 mm treatments. From April to October the wool at 40 mm treatment had higher growth rates than the shelter treatment and this in turn provided higher rates than the 20 mm treatment and the standard treatments. The minimum growth rate for the standard treatment was in July, 263 g/day, and when fleece length was reduced to 5 mm this rate dropped to 202 g/day (Figure 2). Simulating near ideal environmental conditions by providing shelter in the feedlot and having fleece length at 40 mm enabled an almost constant growth rate throughout the year indicating that thermal stress was almost completely alleviated.
Figure 2. Monthly predicted growth rates (g/day) for Standard (t), Shelter (¢), Fleece Length 5 mm (p), Fleece Length 20 mm (Í), Fleece Length 40 mm (r) and Shelter & Fleece Length 40 mm (£) treatments.
Duddy et al. (2007) suggested that buying light lambs to feedlot, and then selling them at trade weights of below 40kg live weight, is generally not recommended. In all treatments growth rates were in excess of this minimum live weight with the lowest live weight for the 5mm fleece treatment being just over 42 kg in July. For the 15mm fleece treatment the sale live weight was very close (44.2 kg in July) or greater than 45kg per head (46.5 kg in January). There is provision in the model for sheep to remain in the feedlot for a longer period of time. However for simplicity, in this paper, the number of lots per year for held constant for all treatments.
3.1.2 Feed conversion ratio
As expected, the feed conversion ratios decreased in response to the alleviation of thermal stress due to lower maintenance requirements of the lambs. The feed conversion ratio for lambs modelled with the combination treatment was less affected by variations in environmental conditions when compared to the other treatments. For this treatment, the feed conversion ratio was found to vary from a high of 5.22, in July, to a low of 4.54 in January (Figure 3). From the months of May to October the feed conversion ratio of lambs modelled with all other treatments was found to be higher, peaking at 6.97 in July for the standard treatment and 9.09 for lambs with 5 mm wool (Figure 3).
Figure 3. The variation of feed conversion ratio, calculated monthly, measured as dry matter intake per liveweight gain (kg/kg) for Standard (t), Shelter (¢), Fleece Length 5 mm (p), Fleece Length 20 mm (Í), Fleece Length 40 mm (r) and Shelter & Fleece Length 40 mm (£) treatments.
3.1.3 Voluntary feed intake
In this model, feed intake was a function of ambient temperature and hence introducing shelter was the only treatment that influenced feed intake. As expected, voluntary feed intake increased from summer to winter. Due to the uniform decrease in temperature throughout the year, voluntary feed intake was slightly higher for the shelter treatment than for the standard treatment for every month of the year. The peak was in July where the feed intake for the shelter treatment was 1.86 kg/day compared to 1.84 kg/day for the standard treatment (Figure 4).
Figure 4. The monthly variation in voluntary feed intake for lambs for Standard (t), and lambs provided with Shelter (¢).
3.1.4 Model validation
In order to validate the results of this study, the calculated growth rates and feed conversion ratios should be comparable to those of a commercial feedlot. Kirby and Beretta (2004) acknowledged that there is a range of growth rates reported in the scientific literature but generally the literature supports growth rates of 140 to 350 grams per day. Hallam (2007) suggested that the expected growth rates for second cross prime lambs (for example Merino × Border Leicester × Cheviot) is expected to range from 150 to 450 g/day with a realistic feed conversion ratio of 6:1, dry matter intake to weight gain. These findings are in line with the growth rates and feed conversion ratios calculated by the bioeconomic model so indicating that the model is able to produce valid results. The monthly variations of growth rate and feed conversion ratio that were predicted by this model were also similar to commercial feedlot lambs. Brink and Ames (1975) suggested that lamb growth rates are commonly higher in summer with lower feed conversion ratios compared to those found in winter.
Further, as Dubby et al. (2007) emphasized, if lambs are shorn in cold weather and they do not have adequate protection then the lamb growth rates will be poor and there will be an increased risk of mortality. Moreover, Brink and Ames (1975) demonstrated that average daily gain was reduced when lambs were cold stressed compared to animals grown at neutral temperatures. Ames and Brink (1977) suggested that a reduction in growth rate is expected in response to cold stress because of the lower digestibility and the increase in maintenance requirements to maintain homeostasis. The results from the model presented in this paper supported these findings and indicated that fleece length can have a significant bearing on lamb growth rate.
Eco-shelters have been adopted in a number of intensive livestock systems namely pigs and poultry, but others to a lesser degree. Shelter is important for the wellbeing of stock particularly for recently shorn animals, younger animals and animals with a high internal heat load, such as lot-fed lambs (Fisher 2007). Sheep provided with shelter were found to have a lower respiration rate under mild heat stress (28.2°C) at 80 respirations per minute compared to 125 without shelter (p<0.05) (Silanikove 1987). Rectal temperature increased from 39.0±0.3 °C with shelter provided to 39.7±0.3 °C without shelter (Silanikove 1987). The results from this study suggested that even under mild heat stress, the addition of shelters reduced the impact of heat stress experienced by sheep. Eco-shelters can also be adapted to help animals cope with cold stress through the addition of wind breaks to reduce the wind chill effect. Gregory et al. (1999) showed that the provision of a wind break reduced wind speed by 61% and heat loss by 35% on a model sheep. Likewise, the findings from the model presented in this paper indicated that reducing the effects of wind, rain and temperature on the lamb all had positive effects on growth rates.
3.2 Economic results
In terms of economic performance for the standard and fleece length treatments, the fleece length (40 mm) treatment resulted in the greatest NPV ($195,785), over ten years with a 7% discount rate[9]. The fleece length (20 mm) treatment was ranked second, followed by the standard treatment ($128,240) and the fleece length (5 mm) treatment ($62,526) (Figure 5). Increased wool length may increase management costs and affect skin prices and can be included in the model, but for simplicity these parameters were not considered in this analysis.
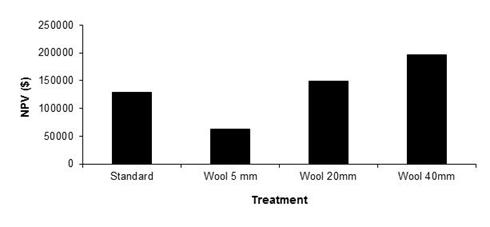
Figure 5. The net present value (NPV), discounted at 7 %, for the standard, and fleece length treatments.
The economic net benefits are contingent upon the cost of a shelter and as this cost is farm specific, no attempt was made to price a shelter. When the NPV for the shelter treatment was equated with that of the standard treatment, the maximum amount that a rational producer would spend on a shelter was just over $43,840. Setting the NPV for the combination treatment (with fleece length at 5mm) equal to that for the fleece length (5 mm) treatment, $53,190 was available to spend on a shelter. However, when the fleece length was at 40mm, simulating the conditions of a shelter resulted in the NPV increasing by just under $29,400. Based on the assumptions used for the example presented in this paper it would be rational for a producer to spend more on a shelter if the fleece length was short compared to a longer fleece length. The ballpark price range of shelters currently available is in line with those suggested by this analysis.
In 2007, 14% of lambs in Australia were finished in a lot-feeding system (Hallam 2007) with the traditional confinement period being over summer and autumn. In comparison to the cooler months, growth is higher and feed intake is lower, resulting in more efficient lamb production (Brink and Ames 1975). While the runs done in the model for this paper have the feedlot in operation for the entire year, it is evident that this may not be the optimal solution depending on the value of the model parameters.
A simple gross margin analysis was completed in this paper to provide an example of the effect of purchase price on the annual net revenue. Using the standard treatment, the purchase price for lambs in August was increased by $0.30/kg whilst the price of lambs in the remaining months did not change from the standard treatment. The gross margin for all lots, except for Lot 7 in which lambs were purchased in August, was above $0.00 (Figure 6). Further, in comparison to the standard treatment, the gross margin for Lot 6 increased by just over $6,000 due to the increase in August of lamb sale price.
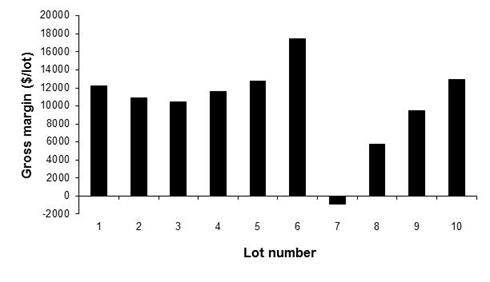
Figure 6. The gross margin for each lot using standard parameter values but with a $0.30/kg increase in lamb price for August.
Given this finding it may be rational for the producer to exclude Lot 7 from his annual plan. If this was done, the NPV over the 10 years would rise from just over $112,200 to around $147,670 which is also greater than the standard NPV (Figure 7).
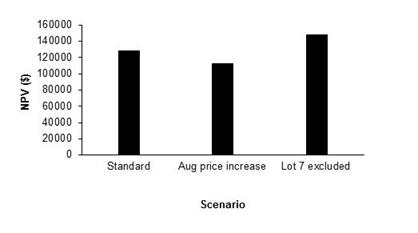
Figure 7. The net present value (NPV), discounted at 7 %, for the standard treatment, when the August lamb price was increased by $0.30/kg and when Lot 7 was excluded from the annual plan.
4. Conclusion
Despite the model being simulated for a feedlot based in Kellerberrin, it is possible to alter the climatic variables to be consistent with alternate locations. As such there is the potential to assess the viability of a lot-feeding operation at any location, of any size and with the input costs unique to that operation thus giving the model the potential for wider ranging commercial application. Being a simulation model, there are an infinite number of assumptions that could be made to simulate results and using the model to make specific monthly changes could also assist with feedlot management decisions.
From the examples presented in this paper the bioeconomic model is capable of showing how the alleviation of thermal stress can result in higher growth rates and more efficient feed conversion ratios ultimately leading to improved profitability of commercial feedlots. It also indicates that, based on simple assumptions, a commercial feedlot run continuously throughout the year could be a viable business investment and through the addition of shelters and the implementation of fleece length strategies, the returns could be enhanced. While results from the model showed that environmental factors affect lamb production in accordance with the literature, further model development as additional biological equations become available, would be useful.
There are limitations to the model as it currently stands because it relies on the available biological equations. Due to the complexity of the biological equations, growth rate is calculated as the average monthly growth rate and not daily growth rate. In response to heat stress, ruminants have a number of heat induced physiological mechanisms allowing them to either alter heat production or heat dissipation including increased respiration, profuse sweating (Blazquez et al. 1994) and reduced feed intake (Silanikove 1992; Dixon et al. 1999). However, Silanikove (1987) found that at 28°C Merinos provided with shelter did not alter feed intake or weight despite increased stress. Hence more research is required to determine whether a standard increase in temperature produces a standard decrease in feed intake as was assumed in this model.
It has been well established that as humidity increases the effectiveness of evaporative heat loss is reduced and that the maintenance costs of heat loss are subsequently increased (Finch 1985). However, due to the lack of an established biological relationship between humidity and its effects on growth, the maintenance values during summer may have been underestimated in the model potentially overestimating growth rates and feed conversion efficiencies. This is particularly important with higher temperatures where evaporative heat loss becomes the main mechanism for heat loss (Blazquez et al. 1994).
Another factor that is missing from the model that affects growth rate is non-climate related stress, which includes the physical environment that the animal is confined to (Webster 1983). Equations relating this form of stress to growth rate are unavailable and as a result of their exclusion, growth rates and feed conversion ratios may have been overestimated using this model.
Other areas of future research involve the application of the model itself. For example, methane production and other pollutants relating to commercial feedlots are currently an issue for Australian agriculture. With current research addressing these issues, biological equations arising from this work could be incorporated into the model. Producers would then have a decision tool that could show how different management strategies could affect feedlot viability.
AFRC (1993) ‘Energy and protein requirements of ruminants. An advisory manual prepared by the AFRC Technical Committee on responses to nutrients.’ (CAB International: Wallingford, UK)
Alford AR, Cacho OJ, Davies BL and Griffith GR (2006) Economic models of the Northern Tablelands livestock grazing system for assessing sheep industry technologies in a whole-farm context. International Journal of Sheep and Wool Science 54(3), 26-54
Ames DR, Brink DR (1977) Effect of temperature on lamb performance and protein efficiency ratio. Journal of Animal Science 44, 136-144.
Ames DR, Ray DE (1983) Environmental manipulation to improve animal productivity. Journal of Animal Science 57, 209-220.
Blazquez NB, Long SE, Mayhew TM, Perry GC, Prescott NJ, Wathes CM (1994) Rate of discharge and morphology of sweat glands in the perineal, lumbodorsal and scrotal skin of cattle. Research Veterinary Science 57, 277-284.
BOM (2008). Climate statistics for Australian locations: Monthly climate statistics. Bureau of Meteorology, Commonwealth of Australia. Retrieved 13 September from: <http://www.bom.gov.au/climate/averages/tables/cw_010073.shtml>
Brink DR, Ames DR (1975) Effect of ambient temperature on lamb performance. Journal of Animal Science 41, 264 (Abstr.)
Christopherson RJ, Kennedy PM (1983) Effects of the thermal environment on digestion in ruminants. Canadian Journal of Animal Science 63, 477-496.
Denek N, Can A, Tufenk S, Yazgan K, Ipek H, Iriadam M (2006) The effect of heat load on nutrient utilization and blood parameters of Awassi ram lambs fed different types and levels of forages. Small Ruminant Research 63, 156-161.
Dixon RM, Thomas R, Holmes JHG (1999) Interactions between heat stress and nutrition in sheep fed roughage diets. Journal of Agricultural Science 132, 351-359.
Duddy G, Bell AK, Shands CG, Hegary RS, (2007) Feedlotting lambs. Primefact 523, NSW Department of Primary Industries. pp 12
Finch VF (1985) Comparison of Non-evaporative heat transfer in different cattle breeds. Australian Journal of Agricultural Research 36, 497-508.
Fisher MW (2007) Shelter and welfare of pastoral animals in New Zealand. New Zealand Journal of Agricultural Research 50, 347-359.
Fuquay JW (1981) Heat stress as it affects animal production. Journal of Animal Science 52, 164-174.
Gregory NG, Haslett SJ, Pedley JC (1999) Studies on lamb hypothermia using a model lamb. New Zealand Journal of Agricultural Research 42, 179-185.
Hallam G (2007) Agriculture notes- Feedlotting lambs. Department of Primary Industries, State of Victoria.
Hofmeyer HS, Je Guidry A and Waltze FA (1969) Effects of temperature and wool length on surface and respiratory evaporative losses of sheep. Journal of Applied Physiology 26(5), 517-523
Kirby RM, Beretta V (2004) Chapter 6. Feeding grain to confined sheep. In ‘Feeding grain for sheep meat production’. (Ed. HM Chapman) pp. 57–79. (Australian Sheep Industry CRC: Armidale)
Marai IFM, El-Darawany AA, Fadiel A, Abdel-Hafez MAM (2007) Physiological traits as affected by heat stress in sheep- A review. Small Ruminant Research 71, 1-12.
McLeod B. (2003). Comparing lamb marketing methods. Agfact A3.8.6, (First Ed.) Agdex 121/13. New South Wales Agriculture, Australia.
Pluske JM, Schlink AC (2008) Water management as a future necessity in sheep feedlots. Australian Journal of Experimental Agriculture 48, 641-647.
Robison LJ, Barry PJ, (1996) Present Value Models and Investment Analysis. The Academic Page, Northport, Alabama.
SCARM (1990) ‘Feeding standards for Australian livestock: ruminants.’ Standing Committee on Agriculture, Ruminants Subcommittee. (CSIRO Publishing: Melbourne)
Seymour M (2000) Lot feeding prime lambs. Department of Agriculture, Farmnote 73/00, South Perth, Western Australia.
Sherwin CM and Johnson KG (1990) Skin and Abdominal Temperatures Recorded by Data Loggers Attached to Merino Sheep Voluntarily Staying Out of Shade. Australian Journal of Agricultural Research 41, 781-90.
Silanikove N (1987) Impact of shelter in hot Mediterranean climate on feed intake, feed utilization and body fluid distribution in sheep. Appetite 9, 207-215.
Silanikove N (1992) Effects of water scarcity and hot environment on appetite and digestion in ruminants: a review. Livestock Production Science 30, 175-194.
Steadman RG (1994) Norms of apparent temperature in Australia. Australian Meteorology Magazine 43, 1-16.
Webster AJF (1983) Environmental stress and the physiology, performance and health of ruminants. Journal of Animal Science 57, 1584-1593.
West JW (2003) Effects of heat stress on production in dairy cattle. Journal of Dairy Science 86, 2131-2144.
Wiese SC, White CL, Masters DG, Milton JTB, Davidson RH (2003) Growth and carcass characteristics of prime lambs fed diets containing urea, lupins or canola mean as a crude protein source. Australian Journal of Experimental Agriculture 43, 1193–1197.
Young BA (1983) Ruminant Cold Stress: Effect on Production. Journal of Animal Science 57:1601-1607.
Yousef MK (1985) Thermoneutral zone. In: Yousef MK (Ed.) Stress physiology in livestock. Volume 1. Boca Raton, FL, USA CRC Press, pp 67–74.
Yousef MK, Johnson HD (1967) Calorigenesis of cattle as influenced by hydrocortisone and environmental temperature. Journal of Animal Science 26, 1087-1093.
Appendix 1
Table A1. Average monthly 9am and 3pm temperature (C°) and wind-speed (km/h), recorded from 1957 to 2008, along with mean rainfall (mm) and days of rainfall recorded from 1892 to 2008 for Kellerberrin (-31.62 S, 117.72 E) (Source: BOM 2008).
|
|
Jan |
Feb |
Mar |
Apr |
May |
Jun |
Jul |
Aug |
Sep |
Oct |
Nov |
Dec |
|
9am wind speed |
15.7 |
14.5 |
13.7 |
11.6 |
9.7 |
10.2 |
9.9 |
9.7 |
12.2 |
13.6 |
13.6 |
14.7 |
|
3pm wind speed |
14.3 |
14.3 |
13.5 |
12.5 |
13.1 |
14.1 |
14.6 |
14.1 |
15.3 |
14.9 |
14.5 |
14.1 |
|
9am temperature |
24.1 |
23.5 |
21.3 |
17.8 |
13.6 |
11 |
9.9 |
10.6 |
13.5 |
17.1 |
20.5 |
22.9 |
|
3pm temperature |
32.6 |
32 |
29.1 |
24.4 |
19.9 |
16.6 |
15.5 |
16.4 |
19.2 |
23.6 |
27.5 |
30.8 |
|
Mean rainfall |
12.7 |
14.4 |
20.6 |
21.7 |
42.5 |
55 |
51.9 |
41.4 |
26 |
17.8 |
11.5 |
13 |
|
Days of rainfall |
2 |
2.3 |
3.3 |
4.7 |
8.4 |
11.7 |
12.9 |
11 |
8 |
5.5 |
3.1 |
2.4 |
Appendix 2
In addition to those documented in Section 2 above, the following biological equations were used in the model.
Live weight gain
Liveweight Gain Formulae for an individual animal (adapted from AFRC 1993)
![]()
![]()
![]()
![]()
Where: Live weight gain (![]() ) predicted live weight
gain (
) predicted live weight
gain (![]() ) and predicted live weight loss (
) and predicted live weight loss (![]() ) are
in kg/day; metabolisable energy requirement for maintenance (
) are
in kg/day; metabolisable energy requirement for maintenance (![]() ) and metabolisable
energy of feed (
) and metabolisable
energy of feed (![]() ) are in MJ/day; and dry matter
intake (D) is in kg/day
) are in MJ/day; and dry matter
intake (D) is in kg/day
Predicted live weight with weight gain (kg/day)
![]()
Where: Metabolisable energy retained by animal as body
tissue (![]() ) is in MJ/day; and prediction
of energy requirements for gain (
) is in MJ/day; and prediction
of energy requirements for gain (![]() ) is in MJ/kg.
) is in MJ/kg.
Predicted live weight with weight loss (kg/day)
![]()
Where: Prediction of energy requirements for loss (![]() )
is in MJ/kg
)
is in MJ/kg
Metabolisable energy requirement for maintenance (MJ/day)
![]()
Where: Standard live weight of lamb (W) is in kg; and efficiency of utilising metabolisable energy for maintenance (km) is a number between 0 and 1.
Metabolisable energy of feed (MJ/day)
![]()
Where: Metabolisable energy for each feed
component (![]() ) is in MJ/day
) is in MJ/day
Dry matter intake (kg/head/day)

Where: Dry matter for each feed component (![]() ) is
expressed as a percentage.
) is
expressed as a percentage.
Efficiency of utilising ME for maintenance
![]()
Where: Metabolisability of gross energy at maintenance (M) is a ratio
Metabolisable energy retained by the animal as body tissue (MJ/day)
![]()
Where: Efficiency of utilising metabolisable energy for growth (kg =0.78M+0.006) and is a number between 0 and 1.
Prediction of energy requirements for gain (MJ/kg)
![]()
Where: the
standard reference weight of lamb (![]() ) is in kilograms; and the
correction for feeding level when metabolisable energy intake is known and
weight gain to be predicted is a ratio:
) is in kilograms; and the
correction for feeding level when metabolisable energy intake is known and
weight gain to be predicted is a ratio:
![]()
Prediction of energy requirements for loss (MJ/kg)
![]()
The metabolisability of gross energy at maintenance
![]()
![]()
Where: Gross energy in the feed (MJ/day) is:
![]()
With Gross energy for each feed component (![]() ) in MJ/day.
) in MJ/day.
Maintenance requirements
Metabolisable energy at maintenance (MJ/day) (adaptation of SCARM (1990): equation 1.22, page 24):
![]()
Where: it is assumed that parameters K, S & M all
equal 1; W is initial live weight (kg); additional energy for cold
stress when below lower critical temperature (![]() ) is in MJ/day; age to
maximum of 6 years (A) is in years; and when animals
are in stall, pens or yards it is generally assumed that additional energy for grazing (EGRAZE) (
) is in MJ/day; age to
maximum of 6 years (A) is in years; and when animals
are in stall, pens or yards it is generally assumed that additional energy for grazing (EGRAZE) (![]() ) in MJ/day,
is zero.
) in MJ/day,
is zero.
The additional energy needed when the animal is cold stressed is referred to as ECOLD (MJ/day) (adaptation of SCARM (1990): equation 1B.1, page 72):
![]()
Where: Animal surface area (a) is in m2;
lower critical temperature (![]() ) and ambient temperature (
) and ambient temperature (![]() ) are
in °C; tissue insulation (
) are
in °C; tissue insulation (![]() ) (set to 1.3
for sheep (SCARM 1990, page 73)) and external insulation (
) (set to 1.3
for sheep (SCARM 1990, page 73)) and external insulation (![]() )
)
Animal surface area (m2) (adaptation of SCARM (1990): equation 1B.2, page 72):
![]()
Lower critical temperature (°C) where it is assumed that metabolic heat production is the same as heat produced by the animal (adaptation of SCARM (1990): equation 1B.4, page 73):
![]()
Where: Evaporative loss (1.3 for sheep) (![]() ) is in
MJ/m2/day
) is in
MJ/m2/day
External insulation (adaptation of SCARM (1990): equation 1B.5, page 73):
![]()
Where: Radius of animal (120 for an adult sheep;
50 for a lamb) (r)is in millimetres; fleece depth (![]() ) is in
millimetres; air velocity (v) is in km/hr; and thermal insulation of
fleece (z) (set to 0.141 for a sheep).
) is in
millimetres; air velocity (v) is in km/hr; and thermal insulation of
fleece (z) (set to 0.141 for a sheep).
Heat loss (adaptation of SCARM (1990) by rearranging first equation page 73 and assuming heat lost equals metabolic heat production):
![]()
Where: the surface temperature (![]() ) is in °C
) is in °C
Total insulation in the rain (adaptation of SCARM (1990): equation 1B.6, page 76):
![]()
Where: Rainfall (R) is measured in mm/day
So with adaption of SCARM (1990), (equations 1B.4 and1B.6 combined, page 24) lower critical temperature (°C) becomes:
![]()
Where it is assumed that mean body temperature in °C (Sherwin and Johnson 1990) is:
![]()
But defaults to 39°C if Tb > 39°C.