Australasian Agribusiness Review - Vol.18 - 2010
Paper 7
ISSN 1442-6951
Rising Demand for Livestock Products in India:
Nature, Patterns and Implications [1]
Vasant P. Gandhi a and Zhang-Yue Zhou b
a Indian Institute of Management, AhmedabadGujarat, India 380015 Email: gandhi@iimahd.ernet.in
b Centre for AusAsia Business Studies, School of Business James Cook University, Townsville QLD 4811 Australia Email: zhangyue.zhou@jcu.edu.au
AbstractWith a large population and recent growth in consumer income, India’s demand for food has increased. However, research continues to emphasise basic foods, and the demand for livestock products remains poorly understood. This study examines the demand for livestock products by Indian consumers using national sample survey data. The study shows that there has been a rapid rise in the demand for livestock products in India. Within the livestock products group, milk and milk products hold the dominant share. Our analysis further suggests that India’s rapid rise in the demand for livestock products may far outpace its domestic supply. Implications are discussed.
Key words: livestock products, demand and supply, India, trade implications
1. Introduction
A number of factors can influence household consumption patterns. These can be economic (e.g., income and price changes), social (e.g., urbanisation leading to dietary changes), cultural (e.g., influences by exotic lifestyles), and market development that makes new foods available (Zhou et al. 2005). Among these factors, however, income is seen to be the most influential. There are a number of studies that show that the level of income affects not only the level but also the composition of food consumption (Cranfield et al. 1998; Regmi et al. 2001; Jones et al. 2003). The increase in consumer income in fast-growing developing countries tends to induce greater changes in the composition of food consumption (Cranfield et al. 1998; Guo et al. 2000; Gould 2002).
Since the early 1990s, India has achieved an impressive pace of economic growth, leading to increased disposable income of Indian consumers. It would have been expected that income growth would lead to changes in the structure of demand for food commodities in India. However, research concerning India’s food consumption continues to be focussed on basic foods (chiefly, foods of plant origin), while the demand for foods of animal origin are poorly understood.
An in-depth understanding of the dynamics of animal product consumption for developing economies like India is invaluable not only for academic exploration but also for policy formation. Generally, foods of animal origin are of higher value. Consumption of animal products will increase only when consumers’ demand for basic foods (starchy foods and other foods of plant origin) is met. Increased consumption of animal products will lead to increased demand for resources to produce animal products, thus competing with the production of other agricultural products and also with the use of grains for human direct consumption. Clearly, increased consumption of animal products will present a series of challenges to India’s policy makers in a number of areas, for example, food security (an on-going issue, with foods of plant origin still the major means to combat food insecurity), industrial structural adjustments and resource reallocation (to cater for the production of animals), environment protection (likely damage to the environment as a result of increased animal production and production intensity), and nutrition education (to prevent excessive or imbalanced nutrition intake). As such, more comprehensive and up-to-date studies of animal product consumption for India are urgently required.
There are a limited number of earlier attempts that looked into animal product consumption in India. These include Sinha and Giri (1989), examining the consumption of livestock products for three states of Gujarat, Punjab and Tripura; Gandhi and Mani (1995), discussing the importance of livestock product demand in India till the late 1980s; and Dastagiri (2004), addressing some general aspects of livestock product demand using data only up to 1993. However, none of these studies offer a comprehensive picture of animal product consumption in India and they are also quite dated. An evaluation of India’s animal product consumption with the latest available data is warranted. This study undertakes this examination using the latest available National Sample Survey data.
In the next section, we first present the levels and composition of general food consumption in both rural and urban India. In Section 3 we present the levels and composition of animal product consumption. In Section 4, we examine the patterns of demand for livestock products across the states and territories. Section 5 is devoted to analysing the relationships between consumer income and animal product consumption. India’s animal product supply is addressed in Section 6, which, together with the analyses from earlier sections, help to shed light on whether India is able to meet its rising demand for animal products in the future.
2. Levels and Composition of Food Consumption
The National Sample Survey (NSS) data are used in our analysis. The NSS data are collected by the National Sample Survey Organisation (NSSO) under the Ministry of Planning from a large sample of households through various annual rounds. The data have a high reputation and acceptance in research and policy. Not all annual rounds extensively cover household consumption behaviour; instead, a comprehensive data collection takes place about every 5 or 6 years. In this study, we use information from NSS surveys conducted in 1970-71, 1977-78, 1983, 1987-88, 1993/94, 1999/00 and 2004/05. These are national surveys with sample sizes of over 100,000 households (both rural and urban). The rural and urban samples are distinct and their results are reported separately. NSSO publishes summary results soon after each survey. More detailed survey reports are generally published a few years later.
Presented in Table 1 are changes in total consumption expenditures over the period 1970/71 to 2004/05. They are averages over all income classes. In rural areas, foods dominate the consumption expenditure. Within foods, cereals dominate. Nonetheless, the percentage of expenditure on foods has dropped from 73.6% in 1970/71 to 55.0% in 2004/05. The percentage of expenditure on cereals within food has dropped from a dominant 54.4% to 32.7% during the same time period. After cereals, livestock products clearly are the next important food group, with an expenditure share reaching 21.4% in 2004/05, being the second largest. Table 1 shows that pulses, edible oils, and vegetables and fruits lag considerably behind in importance compared to livestock products. It is noted, however, the growth in expenditure share on edible oils and vegetables and fruits was quite impressive between 1970/71 and 2004/05.
Table 1. Consumption Expenditure: Rs. Average Per Capita per Month
Item |
Value (Rs.) |
Share (%) |
|||||||
1970/71 |
1977/78 |
1983 |
1987/88 |
1993/94 |
1999/00 |
2004/05 |
1970/71 |
2004/05 |
|
Rural |
|||||||||
Cereals |
14.14 |
22.82 |
36.52 |
41.54 |
68.13 |
107.75 |
100.65 |
54.4 |
32.7 |
Pulses |
1.56 |
2.92 |
4.25 |
6.65 |
10.72 |
18.50 |
17.18 |
6.0 |
5.6 |
Livestock products |
4.03 |
7.13 |
11.85 |
18.74 |
36.09 |
58.70 |
65.91 |
15.5 |
21.4 |
Edible oils |
1.26 |
2.46 |
4.53 |
8.88 |
12.43 |
18.16 |
25.72 |
4.8 |
8.4 |
Vegetables & fruits |
1.70 |
3.37 |
6.86 |
10.80 |
21.90 |
38.34 |
44.49 |
6.5 |
14.5 |
Other food items |
3.27 |
5.63 |
9.71 |
15.21 |
28.50 |
47.35 |
53.65 |
12.6 |
17.4 |
Food total |
25.98 |
44.33 |
73.73 |
100.82 |
177.77 |
288.80 |
307.60 |
73.6 |
55.0 |
Non‑food total |
9.33 |
24.56 |
38.71 |
57.28 |
103.63 |
197.36 |
251.18 |
26.4 |
45.0 |
Total cons. Exp. |
35.31 |
68.89 |
112.45 |
158.10 |
281.40 |
486.16 |
558.78 |
100.0 |
100.0 |
No. of sample hhs |
87593 |
99766 |
75911 |
83039 |
69206 |
71385 |
79296 |
||
Urban |
|||||||||
Cereals |
12.12 |
19.76 |
31.98 |
37.14 |
64.27 |
105.57 |
105.82 |
35.6 |
23.7 |
Pulses |
1.76 |
3.67 |
5.60 |
8.85 |
13.92 |
24.25 |
22.51 |
5.2 |
5.0 |
Livestock products |
6.91 |
12.49 |
21.07 |
32.68 |
60.39 |
100.95 |
111.77 |
20.3 |
25.0 |
Edible oils |
2.41 |
4.46 |
7.94 |
13.23 |
20.09 |
26.81 |
36.37 |
7.1 |
8.1 |
Vegetables & fruits |
3.35 |
6.11 |
11.63 |
19.39 |
37.17 |
64.58 |
70.49 |
9.8 |
15.8 |
Other food items |
7.49 |
11.18 |
18.75 |
28.46 |
54.48 |
88.68 |
100.45 |
22.0 |
22.5 |
Food total |
34.04 |
57.67 |
96.97 |
139.75 |
250.32 |
410.84 |
447.41 |
64.4 |
42.5 |
Non‑food total |
18.81 |
38.48 |
67.06 |
110.18 |
207.72 |
444.08 |
604.95 |
35.6 |
57.5 |
Total cons. Exp. |
52.85 |
96.15 |
164.03 |
249.93 |
458.04 |
854.92 |
1052.36 |
100.0 |
100.0 |
No. of sample hhs |
18930 |
58162 |
41983 |
45989 |
46148 |
48924 |
45346 |
||
Source: NSSO, National Sample Survey, various years.
In urban areas, the share of expenditure on food has also dropped but still remains substantial at 42.5%. However, the importance (share) of livestock products has increased to 25% by 2004/05, surpassing the share of cereals which has fallen to 23.7%. The cross-over is recent and took place between the last two surveys. Other foods such as pulses, edible oils, and vegetables and fruits lag substantially behind livestock products.
The results show that, in both rural and urban areas, livestock products have risen substantially in importance. It is noted that, food expenditure in India by 2004/05 still accounted for a significant share of total consumption expenditure, being 50% on an all-India basis, with rural being 55% and urban 42.5%.
Table 2 provides further details about the levels and composition of food demand and livestock product demand in India. It is based on the latest data from NSS (2007) for 2004/05. All-India results are a weighted average using population as the weight. The results indicate substantial diversity in consumption quantities and values. The total consumption expenditure at Rs 1052 per month in urban areas is almost twice that in rural areas at Rs 559 per month. However, the total food expenditure does not differ by that much, with a difference being Rs 140. It is important to note that the consumption difference in livestock products explains the largest portion of the total food consumption difference. This suggests that there is an enormous potential for an increase in livestock product consumption if rural income was higher given the huge rural population in India.
Table 2. Per Capita Consumption: Quantity and Value Per Month, 2004/05
Item |
Rural |
Urban |
All India |
|||
Quantity (kg*) |
Value (Rs) |
Quantity (kg*) |
Value (Rs) |
Quantity (kg*) |
Value (Rs) |
|
Rice |
6.376 |
58.93 |
4.711 |
56.14 |
5.954 |
58.22 |
Wheat |
4.192 |
29.83 |
4.359 |
38.86 |
4.234 |
32.12 |
Cereals Total |
12.114 |
100.65 |
9.940 |
105.82 |
11.564 |
101.96 |
Pulses |
0.705 |
17.91 |
0.824 |
23.62 |
0.735 |
19.36 |
Livestock Products |
- |
65.91 |
- |
111.77 |
- |
77.52 |
Edible Oils |
0.484 |
25.72 |
0.663 |
36.37 |
0.529 |
28.42 |
Vegetables |
- |
36.23 |
- |
49.91 |
- |
39.69 |
Fruits |
- |
10.42 |
- |
23.65 |
- |
13.77 |
Sugar |
0.741 |
13.25 |
0.869 |
15.88 |
0.773 |
13.92 |
Spices (Gm) |
75.919 |
10.62 |
189.756 |
13.13 |
104.738 |
11.26 |
Beverages & Other |
- |
25.37 |
- |
65.31 |
- |
35.48 |
Total Food |
- |
307.60 |
- |
447.41 |
- |
342.99 |
Total Non-Food |
- |
251.18 |
- |
604.95 |
- |
340.74 |
Total |
- |
558.78 |
- |
1052.36 |
- |
683.73 |
* Quantity in kg unless otherwise stated.
Source: NSSO 2007, 61st Round.
Figure 1 shows the distribution of food expenditure across different food commodity groups. In rural areas, cereals constitute a larger share of food expenditure at 34%. This is followed by livestock products which constitute 22% of the food expenditure. In urban areas, the share of the livestock products at 25% is the highest in foods, being greater than that of cereals. Thus, although cereals still dominate at the national level, livestock products have surpassed cereals in importance in urban areas.
Figure 1. Share of Consumer Food Expenditure: Rural, Urban and All India, 2004/05
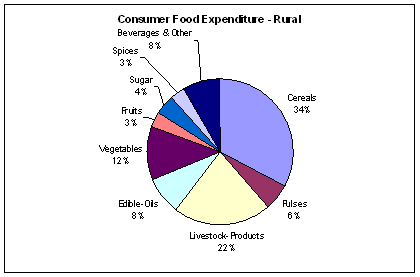
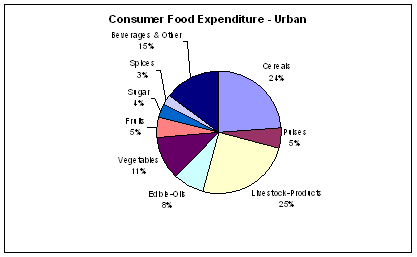
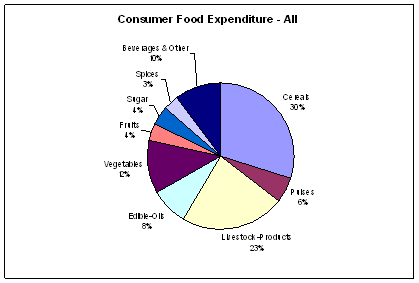
Source: Based on Table 2.
3. Levels and Composition of Livestock Product Demand
The consumption of livestock products is further examined in this section. Table 3 shows the quantity and value of per capita monthly consumption of livestock products in 2004/05. Livestock product expenditure in urban areas at Rs 112 is significantly higher than that in rural areas, being Rs 66. A substantial part of this difference comes from milk and milk products which stand at Rs 47.31 in rural areas and Rs 83.30 in urban areas.
Table 3. Per Capita Consumption of Livestock Products: Quantity and Value Per Month, 2004/05
Item |
Rural |
Urban |
All |
|||
Quantity (kg*) |
Value (Rs) |
Quantity (kg*) |
Value (Rs) |
Quantity (kg*) |
Value (Rs) |
|
Milk & milk products total |
- |
47.31 |
- |
83.30 |
- |
56.42 |
Egg, fish & meat total |
- |
18.60 |
- |
28.47 |
- |
21.10 |
Eggs (No.) |
1.01 |
1.82 |
1.72 |
3.02 |
1.19 |
2.12 |
Fish |
0.20 |
7.49 |
0.21 |
9.51 |
0.20 |
8.00 |
Meat total |
0.14 |
9.30 |
0.22 |
15.95 |
0.16 |
10.98 |
Livestock products total |
- |
65.91 |
- |
111.77 |
- |
77.52 |
* Quantity in kg unless otherwise stated.
Source: NSSO 2007, 61st Round.
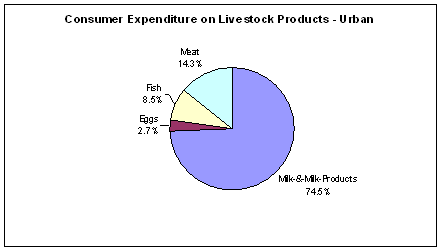
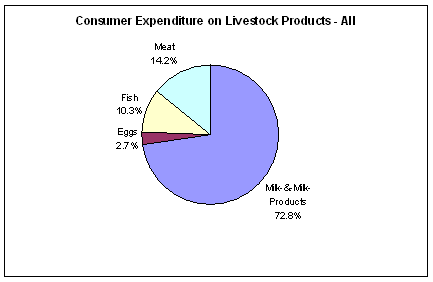
Figure 2 presents the relative distribution within livestock products. It shows that milk and milk products have the largest share in the livestock product demand. In rural areas, the share is 71.8% and in urban areas it is even higher at 74.5%. At the national level, the share comes to 72.8%. This dominance of milk and milk products is apparently unique to India and may be associated with largely vegetarian diets and food habits in India. Meat follows after a huge margin with a share of about 14% in both rural and urban samples. This is followed by fish, the share of which is higher at 11.4% in rural areas as compared to 8.5% in urban areas. Eggs hold only a small share of around 2.7%. Given the dominance of milk and milk products and meats in the consumption of livestock products in India, a further analysis of these two items is provided below.
Figure 2. Share of Expenditure on Livestock Products: Rural, Urban and All India, 2004/05
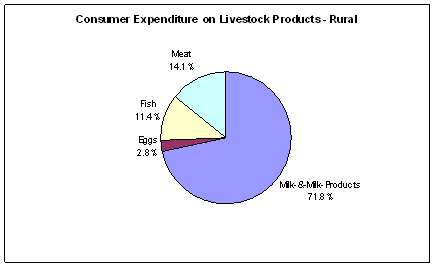
Source: Based on Table 3.
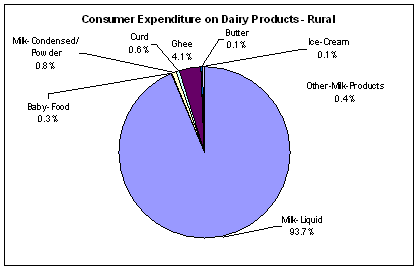
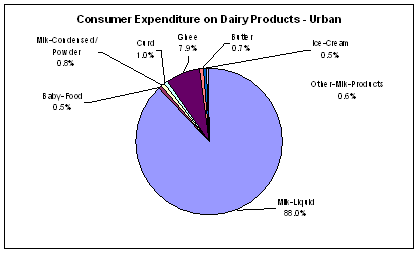
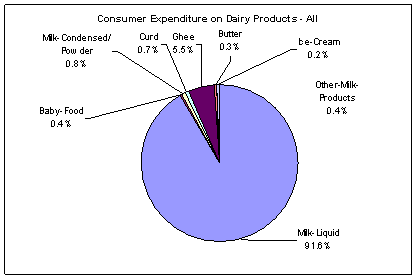
Milk and Milk Products Table 4 provides further break-up within milk and milk products consumption. Milk and milk products include liquid milk, baby food, condensed milk, milk powder, curd, butter, ghee (clarified butter), ice-cream and other milk products. The demand for milk and milk products is dominated by liquid milk. Its share amounts to 93.7% in rural areas, and 88% in urban areas, with a national average being 91.6% (see Figure 3). This means the consumption of other milk products accounted for only 6.3%, 12% and 8.4% of the total dairy product demand, respectively, in rural areas, urban areas and nationally. Among all other milk products, ghee has the largest share being 4.1% in rural areas, 7.9% in urban areas, and 5.5% nationally. None of the rest of other milk products even approaches 1% of milk and milk products consumption.
Table 4. Per Capita Consumption of Dairy Products: Quantity and Value Per Month, 2004/05
Item |
Rural |
Urban |
All |
|||
Quantity (Kg*) |
Value (Rs) |
Quantity (Kg*) |
Value (Rs) |
Quantity (Kg*) |
Value (Rs) |
|
Milk-Liquid (Litre) |
3.866 |
44.32 |
5.107 |
73.30 |
4.180 |
51.66 |
Baby Food |
0.003 |
0.16 |
0.006 |
0.45 |
0.004 |
0.23 |
Milk Condensed/ Powder |
0.009 |
0.37 |
0.008 |
0.66 |
0.009 |
0.44 |
Curd |
0.016 |
0.28 |
0.039 |
0.83 |
0.022 |
0.42 |
Ghee |
0.017 |
1.94 |
0.042 |
6.54 |
0.023 |
3.10 |
Butter |
0.001 |
0.04 |
0.009 |
0.60 |
0.003 |
0.18 |
Ice-Cream |
- |
0.04 |
- |
0.41 |
- |
0.13 |
Other Milk Products |
0.039 |
0.17 |
0.041 |
0.50 |
0.040 |
0.25 |
Milk Products Total |
- |
2.99 |
- |
10.00 |
- |
4.76 |
Milk & Milk Products Total |
- |
47.31 |
- |
83.30 |
- |
56.42 |
* Quantity in kg unless otherwise stated.
Source: NSSO 2007, 61st Round.
Figure 3. Share of Expenditure on Dairy Products: Rural, Urban and All India, 2004/05
Source: Based on Table 4
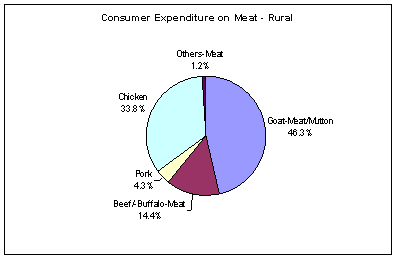
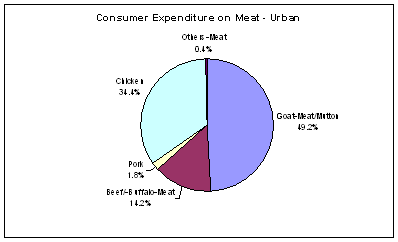
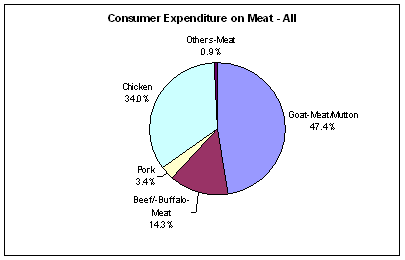
Meats Table 5 shows the levels and composition of the components of meat demand. The meat expenditure in urban areas at Rs 15.95 is considerably higher than that in rural areas at Rs 9.30. The quantity stands at 0.158 kg per capita per month nationally. This is constituted by goat meat/mutton, beef/buffalo meat, pork, chicken and other meats. The relative distribution of meat demand is shown in Figure 4. The largest is goat meat/mutton with a share of 46.3% in rural areas, 49.2% in urban areas, and 47.4% nationally. The other major meat in demand is chicken which has a share of about 34% across both samples. Beef/buffalo meat has a small share of around 14%, perhaps due to the religious taboo against beef. Pork has a share of only 3-4%, and other meats about 1%. Clearly, meat consumption in India is dominated by goat meat/mutton, and chicken. In terms of the quantity consumed per capita, the consumption of meats in India is very small.
Table 5. Per Capita Consumption of Meats: Quantity and Value Per Month, 2004/05
Item |
Rural |
Urban |
All |
|||
Quantity (kg*) |
Value (Rs) |
Quantity (kg*) |
Value (Rs) |
Quantity (kg*) |
Value (Rs) |
|
Goat meat/mutton |
0.047 |
4.31 |
0.070 |
7.85 |
0.053 |
5.21 |
Beef/ buffalo meat |
0.031 |
1.34 |
0.056 |
2.26 |
0.037 |
1.57 |
Pork |
0.006 |
0.40 |
0.005 |
0.29 |
0.006 |
0.37 |
Chicken |
0.050 |
3.14 |
0.085 |
5.49 |
0.059 |
3.73 |
Others meats |
0.003 |
0.11 |
0.002 |
0.06 |
0.003 |
0.10 |
Meat total |
0.137 |
9.30 |
0.218 |
15.95 |
0.158 |
10.98 |
* Quantity in kg unless otherwise stated.
Source: NSSO 2007, 61st Round.
Figure 4. Share of Expenditure on Meats: Rural, Urban and All India, 2004/05
Source: Based on Table 5.
4. Patterns of Demand across the States and Regions
There is a huge variation in the per capita consumption of livestock products across the 35 states/union territories (UTs) of India. Per capita consumption of liquid milk, eggs, fish, goat meat/mutton and chicken are shown in Table 6, which clearly demonstrates the differences in livestock product consumption across the country. The coefficient of variation ranges from 68% for goat meat/mutton to 352% for fish.
Table 6. Monthly Per Capita Consumption of Selected Livestock Products by State/Union Territories, 2004/05
State/UT |
Milk-liquid (litre) |
Eggs (no.) |
Fish (kg) |
Goat meat/ mutton (kg) |
Chicken (kg) |
|
1 |
Andhra-Pradesh |
3.3897 |
2.3495 |
0.0723 |
0.0898 |
0.1409 |
2 |
Arunachal-Pradesh |
0.7299 |
2.5128 |
0.4175 |
0.0878 |
0.1578 |
3 |
Assam |
1.3737 |
2.3648 |
0.5911 |
0.0318 |
0.0688 |
4 |
Bihar |
3.0554 |
0.2794 |
0.1469 |
0.0280 |
0.0199 |
5 |
Chhattisgarh |
1.0227 |
0.5878 |
0.1011 |
0.0228 |
0.0677 |
6 |
Delhi |
8.0914 |
1.3316 |
0.0142 |
0.0658 |
0.0947 |
7 |
Goa |
3.4658 |
1.3558 |
1.4896 |
0.0325 |
0.1801 |
8 |
Gujarat |
5.5706 |
0.3247 |
0.0227 |
0.0299 |
0.0213 |
9 |
Haryana |
12.1830 |
0.6806 |
0.0058 |
0.0086 |
0.0365 |
10 |
Himachal-Pradesh |
8.6676 |
0.4836 |
0.0032 |
0.0782 |
0.0129 |
11 |
Jammu & Kashmir |
8.0916 |
1.7934 |
0.0115 |
0.1645 |
0.0921 |
12 |
Jharkhand |
1.8439 |
0.6094 |
0.1322 |
0.0410 |
0.0770 |
13 |
Karnataka |
3.7813 |
1.5363 |
0.1099 |
0.0804 |
0.0994 |
14 |
Kerala |
3.0178 |
2.4887 |
1.8960 |
0.0143 |
0.1869 |
15 |
Madhya-Pradesh |
3.6268 |
0.4746 |
0.0292 |
0.0263 |
0.0216 |
16 |
Maharashtra |
3.3985 |
1.1639 |
0.0799 |
0.1264 |
0.0478 |
17 |
Manipur |
0.2113 |
1.3248 |
0.4100 |
0.0042 |
0.0783 |
18 |
Meghalaya |
0.9213 |
1.8684 |
0.4999 |
0.0121 |
0.1136 |
19 |
Mizoram |
0.9552 |
2.1073 |
0.1448 |
0.0060 |
0.1126 |
20 |
Nagaland |
0.4602 |
3.8628 |
0.3049 |
0.0215 |
0.2229 |
21 |
Orissa |
0.9795 |
0.8497 |
0.2821 |
0.0304 |
0.0500 |
22 |
Punjab |
11.2326 |
0.4811 |
0.0026 |
0.0152 |
0.0268 |
23 |
Rajasthan |
9.0259 |
0.1438 |
0.0026 |
0.0488 |
0.0012 |
24 |
Sikkim |
5.4946 |
1.3813 |
0.0638 |
0.0417 |
0.1262 |
25 |
Tamil-Nadu |
3.3810 |
2.0227 |
0.1262 |
0.0919 |
0.1053 |
26 |
Tripura |
1.2154 |
1.8070 |
0.7453 |
0.0092 |
0.1314 |
27 |
Uttar-Pradesh |
4.7280 |
0.5260 |
0.0443 |
0.0404 |
0.0098 |
28 |
Uttaranchal |
6.5520 |
0.8524 |
0.0313 |
0.0629 |
0.0187 |
29 |
West-Bengal |
1.7313 |
3.2198 |
0.6996 |
0.0296 |
0.1172 |
30 |
A & N-Islands |
1.4915 |
4.5891 |
1.1229 |
0.0474 |
0.2674 |
31 |
Chandigarh |
10.2264 |
0.8905 |
0.0044 |
0.0213 |
0.0592 |
32 |
Dadra & N. Haveli |
1.4339 |
0.5129 |
0.1534 |
0.0526 |
0.1030 |
33 |
Daman & Diu |
3.9982 |
1.0113 |
1.0208 |
0.0434 |
0.0883 |
34 |
Lakshadweep |
0.2423 |
5.1743 |
3.6835 |
0.0556 |
0.2593 |
35 |
Pondicherry |
4.1881 |
3.4623 |
0.4118 |
0.0889 |
0.1465 |
All-India |
4.1802 |
1.1900 |
0.2023 |
0.0528 |
0.0589 |
|
Coefficient of Variation |
79.93 |
105.06 |
358.04 |
68.11 |
117.21 |
Source: NSSO 2007, 61st Round.
Table 6 shows that, on a per annum basis, milk consumption is as low as 2.5 litres per capita in Manipur, but as high as 146.2 litres per capita in Haryana. The lowest and highest consumption of eggs are in Rajasthan and Lakshadweep, being 1.7 eggs and 62.1 eggs per person per annum, respectively. For fish consumption, Lakshadweep again has the highest level of consumption, at 44.2 kg per capita per annum, while Punjab has the lowest, being a tiny 0.03 kg per capita per annum. Per capita annual consumption of both goat meat/mutton and chicken is very low at the all-India level, with a national average being about 0.7 kg only. Manipur’s lowest goat meat/mutton consumption was 0.05 kg while Jammu & Kashmir’s highest was 1.97 kg. Rajasthan has the lowest chicken consumption, being 0.014 kg while A & N-Islands’ highest is 3.21 kg.
In Table 7, we list the top 10 states/UTs that have higher per capita consumption of liquid milk, eggs, goat meat/mutton, and chicken. In the case of milk, most of the states with higher per capita consumption are from the north and west of the country. The consumption of milk in Haryana and Punjab is much higher than the national average, reflecting higher per capita income, as well as consumer preference. There is no clear regional pattern in the case of goat meat/mutton consumption although the states of Jammu & Kashmir and Maharashtra have much higher consumption. In the case of chicken, the states from the south and the east show higher consumption.
Table 7. Top Ten States/UTs in Monthly Per Capita Consumption of Major Livestock Products
Part A: Milk and Eggs
Rank |
Milk-Liquid |
Eggs |
||||
State/UT |
Region |
Milk-liquid (litre) |
State/UT |
Region |
Eggs (no.) |
|
1 |
Haryana |
N |
12.1830 |
Lakshadweep |
S |
5.1743 |
2 |
Punjab |
N |
11.2326 |
A&N-Islands |
S |
4.5891 |
3 |
Chandigarh |
N |
10.2264 |
Nagaland |
E |
3.8628 |
4 |
Rajasthan |
W |
9.0259 |
Pondicherry |
S |
3.4623 |
5 |
Himachal-Pradesh |
N |
8.6676 |
West-Bengal |
E |
3.2198 |
6 |
Jammu & Kashmir |
N |
8.0916 |
Arunachal-Pradesh |
E |
2.5128 |
7 |
Delhi |
N |
8.0914 |
Kerala |
S |
2.4887 |
8 |
Uttaranchal |
N |
6.5520 |
Assam |
E |
2.3648 |
9 |
Gujarat |
W |
5.5706 |
Andhra-Pradesh |
S |
2.3495 |
10 |
Sikkim |
E |
5.4946 |
Mizoram |
E |
2.1073 |
All India |
4.1802 |
All India |
1.1900 |
|||
Part B: Goat Meat/Mutton and Chicken
Rank |
Goat-meat/mutton |
Chicken |
||||
State/UT |
Region |
Goat-meat/ mutton (kg) |
State/UT |
Region |
Chicken (kg) |
|
1 |
Jammu & Kashmir |
N |
0.1645 |
A&N-Islands |
S |
0.2674 |
2 |
Maharashtra |
W |
0.1264 |
Lakshadweep |
S |
0.2593 |
3 |
Tamil-Nadu |
S |
0.0919 |
Nagaland |
E |
0.2229 |
4 |
Andhra-Pradesh |
S |
0.0898 |
Kerala |
S |
0.1869 |
5 |
Pondicherry |
S |
0.0889 |
Goa |
W |
0.1801 |
6 |
Arunachal-Pradesh |
E |
0.0878 |
Arunachal-Pradesh |
E |
0.1578 |
7 |
Karnataka |
S |
0.0804 |
Pondicherry |
S |
0.1465 |
8 |
Himachal-Pradesh |
N |
0.0782 |
Andhra-Pradesh |
S |
0.1409 |
9 |
Delhi |
N |
0.0658 |
Tripura |
E |
0.1314 |
10 |
Uttaranchal |
N |
0.0629 |
Sikkim |
E |
0.1262 |
All India |
0.0528 |
All India |
0.0589 |
|||
Source: NSSO 2007, 61st Round.
Major reasons responsible for such regional variations are the differing food habits and preferences across the country due to the large ethnic diversity. Some of the variation is also because of differences in per capita income across the states – for example, income is much higher in Punjab and Haryana which show high milk consumption. Availability also appears to be a factor, for example, fish consumption is frequently higher in the coastal states as compared to inland states.
5. Engel Curves: The Relationships between Consumption and Income Growth
Understanding the relationships between consumption and income change is very important. Generally, income is considered being the most important factor determining per capita food demand (Cranfield et al. 1998; Guo et al. 2000; Regmi et al. 2001; Gould 2002; Jones et al. 2003; Zhou et al. 2005; Tian and Zhou 2005; Wang and Zhou 2005). The relationship between consumption and income is often referred to as the Engel curve (Timmer, Falcon and Pearson 1983; Hirshleifer, Glazer and Hirshleifer 2005). To examine this, data on food consumption quantities reported by consumers of different income levels (or classes) are required. Such data are not yet available for the 2004/05 NSS survey. However, they are available for the 1999/2000 NSS survey. Hence, data from the 1999/2000 survey are used for examining the income-consumption relationship in this section.
Changes in per capita consumption of major foods with income levels are shown in Figure 5. In rural areas, in general, food demand is low at low income levels, rises when income increases and then tapers off. This can be seen particularly in the case of cereals and pulses. In the case of livestock product consumption, however, the demand rises very rapidly when income rises, and crosses the demand for all other food product groups to become the highest for higher income groups. In urban areas, the demand for livestock products rises even faster when income starts to increase whereas the demand for other food groups rises much less. These results strongly support the proposition that as income rises, the demand for livestock products will tend to rise very rapidly and will surpass the demand for other food groups.
Figure 5. Changes in Per Capita Consumption of Food with Income – Rural and Urban
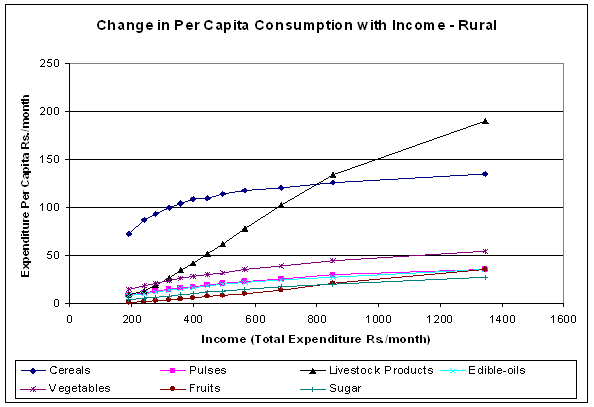
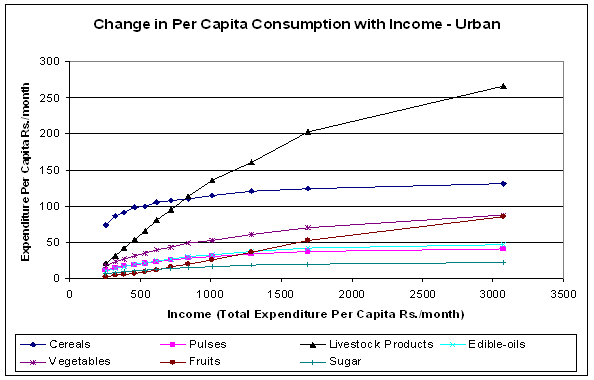
Source: Based on NSSO (2007).
Figure 6 demonstrates how the demand for specific animal product changes with income increases. It shows that, for rural areas, among the different livestock products, milk and milk products have the largest rise with income increases. This is followed, with a huge margin, by meat, then fish and eggs. A similar pattern also exists for urban residents. Clearly, these patterns indicate that income growth is likely to translate into a much higher demand for milk and milk products, but only a modest increase in meat, eggs and fish.
Figure 6. Changes in Per Capita Consumption of Livestock Products with Income – Rural and Urban
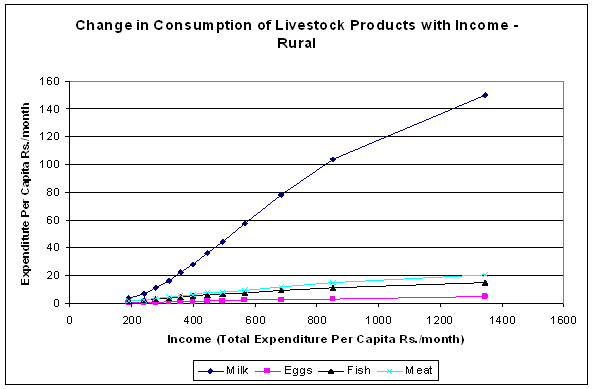
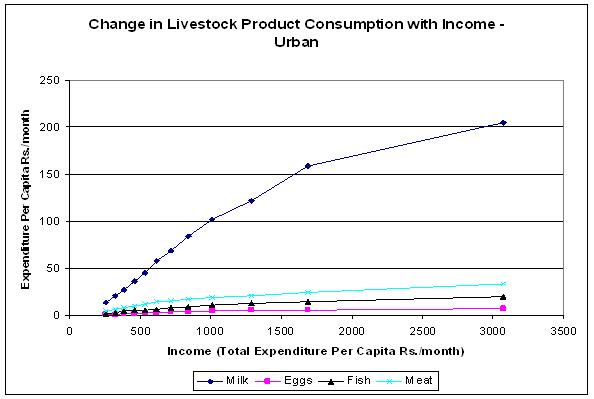
Source: Based on NSSO (2007).
The impact of income change on consumption can be analysed through the estimation of the income elasticity of demand. The income elasticity of demand is the ratio between the percentage change in demand and the percentage change in income. The functional form commonly used to estimate the elasticity is the double-log form which for estimation would take the specification:
log y = α + β log x + μ
where, y = quantity consumed
x = income level
μ = error term
Estimated income elasticity of demand is given by:
η = β
This approach is used to estimate the income elasticities of demand for selected food products in this study. The elasticities are estimated for consumption data both in quantity and value terms depending on the availability of data (See Timmer, Falcon and Pearson (1983) and Gandhi and Mani (1995) for a discussion on methods and estimation). The results including the statistical significance are presented in Table 8 for rural households and Table 9 for urban households. The tables shows that the elasticities are quite low for cereals – around 0.17 for rural and nearly zero for urban for quantity, and around 0.2 to 0.3 for value. For livestock products, however, the elasticities are much higher as a whole: 1.67 for rural and 1.04 for urban for value. This indicates that a one percent increase in income will translate to greater than a one percent increase in demand/expenditure for livestock products.
Table 8. Estimates of Income Elasticities of Demand for Livestock Products and Other Selected Items: Rural Households
Quantity |
Value/ Expenditure |
||||||
Elasticity |
t-statistic |
Signifi-cance |
Elasticity |
t-statistic |
Signifi-cance |
||
Food grains |
|||||||
Rice |
-0.010 |
-0.165 |
0.169 |
2.839 |
** |
||
Wheat |
0.477 |
5.810 |
*** |
0.536 |
5.764 |
*** |
|
Cereals |
0.171 |
3.453 |
*** |
0.294 |
4.920 |
*** |
|
Pulses |
0.656 |
7.286 |
*** |
0.753 |
8.722 |
*** |
|
Livestock Products |
|||||||
Milk: Liquid |
1.821 |
6.765 |
*** |
1.881 |
7.357 |
*** |
|
Milk: Condensed/Powder |
-0.056 |
-0.137 |
1.574 |
63.767 |
*** |
||
Curd |
0.938 |
9.119 |
*** |
1.106 |
30.412 |
*** |
|
Ghee |
2.176 |
7.504 |
*** |
2.193 |
8.104 |
*** |
|
Butter |
- |
- |
- |
- |
|||
Milk Products |
- |
- |
2.503 |
8.613 |
*** |
||
Milk & Milk Products |
- |
- |
1.934 |
7.632 |
*** |
||
Eggs |
1.223 |
7.937 |
*** |
1.227 |
8.600 |
*** |
|
Fish |
0.939 |
5.857 |
*** |
1.093 |
10.318 |
*** |
|
Goat Meat/Mutton |
1.295 |
3.540 |
*** |
1.344 |
6.691 |
*** |
|
Beef/Buffalo Meat |
0.662 |
3.763 |
*** |
0.999 |
10.372 |
*** |
|
Pork |
- |
- |
- |
- |
|||
Chicken |
1.215 |
6.382 |
*** |
1.135 |
10.896 |
*** |
|
Meat Total |
1.244 |
3.833 |
*** |
1.295 |
7.855 |
*** |
|
Egg, Fish & Meat |
- |
- |
1.158 |
9.749 |
*** |
||
Livestock Products – All |
- |
- |
1.669 |
8.803 |
*** |
||
Other Foods |
|||||||
Edible Oils |
0.718 |
7.231 |
*** |
0.761 |
11.024 |
*** |
|
Vegetables |
- |
- |
0.671 |
11.554 |
*** |
||
Fruits |
- |
- |
1.775 |
18.652 |
*** |
||
Sugar |
1.002 |
9.050 |
*** |
1.057 |
9.808 |
*** |
|
Spices |
0.804 |
16.927 |
*** |
||||
Cooked Meals (No.)(Outside) |
1.601 |
6.806 |
*** |
2.107 |
9.956 |
*** |
|
Beverages & Other |
- |
- |
1.474 |
19.574 |
*** |
||
Total Food |
- |
- |
0.816 |
22.534 |
*** |
||
*** Significant at 99%; ** Significant at 95%; * Significant at 90%.
Source:
Estimates Based on NSSO (2001) 55th Round 1999-2000.
Table 9. Estimates of Income Elasticities of Demand for Livestock Products and Other Selected Items: Urban Households
Quantity |
Value/ Expenditure |
||||||
Elasticity |
t-statistic |
Signifi-cance |
Elasticity |
t-statistic |
Signifi-cance |
||
Food grains |
|||||||
Rice |
-0.034 |
-0.432 |
0.212 |
2.786 |
** |
||
Wheat |
-0.003 |
-0.043 |
0.126 |
2.426 |
** |
||
Cereals |
0.005 |
0.095 |
0.216 |
4.160 |
*** |
||
Pulses |
0.447 |
3.649 |
*** |
0.520 |
5.022 |
*** |
|
Livestock Products |
|||||||
Milk: Liquid |
0.955 |
5.309 |
*** |
1.054 |
5.645 |
*** |
|
Milk: Condensed/Powder |
0.252 |
0.587 |
0.486 |
2.796 |
** |
||
Curd |
0.665 |
3.544 |
*** |
0.787 |
4.929 |
*** |
|
Ghee |
1.464 |
3.113 |
** |
1.636 |
4.155 |
*** |
|
Butter |
1.745 |
2.136 |
* |
1.994 |
14.464 |
*** |
|
Milk Products |
- |
- |
1.681 |
4.621 |
*** |
||
Milk & Milk Products |
- |
- |
1.129 |
5.773 |
*** |
||
Eggs |
0.880 |
4.496 |
*** |
0.875 |
4.990 |
*** |
|
Fish |
0.699 |
3.377 |
*** |
0.906 |
5.197 |
*** |
|
Goat Meat/Mutton |
0.766 |
4.165 |
*** |
0.932 |
3.450 |
*** |
|
Beef/Buffalo Meat |
-0.180 |
-0.306 |
-0.340 |
-1.613 |
|||
Pork |
- |
- |
- |
- |
|||
Chicken |
1.255 |
4.134 |
*** |
1.199 |
5.728 |
*** |
|
Meat Total |
0.541 |
5.342 |
*** |
0.771 |
5.233 |
*** |
|
Egg, Fish & Meat |
- |
- |
0.818 |
5.276 |
*** |
||
Livestock Products – All |
- |
- |
1.041 |
5.839 |
*** |
||
Other Foods |
|||||||
Edible Oils |
0.489 |
2.666 |
** |
0.608 |
5.108 |
*** |
|
Vegetables |
- |
- |
0.636 |
7.728 |
*** |
||
Fruits |
- |
- |
1.436 |
10.159 |
*** |
||
Sugar |
0.431 |
3.318 |
*** |
0.490 |
4.688 |
*** |
|
Spices |
0.649 |
6.046 |
*** |
||||
Cooked Meals (No.)(Outside) |
1.386 |
6.221 |
*** |
2.014 |
11.093 |
*** |
|
Beverages & Other |
- |
- |
1.284 |
27.321 |
*** |
||
Total Food |
- |
- |
0.717 |
15.648 |
*** |
||
*** Significant at 99%; ** Significant at 95%; * Significant at 90%.
Source: Estimates Based on NSSO (2001) 55th Round 1999-2000.
Within the livestock products, several of them have high income elasticities. The elasticities are particularly high for liquid milk in rural areas, and for ghee in both rural and urban areas. They are also high for “milk products” and “milk and milk products” in rural areas, and for “milk products” in urban areas. Chicken in both rural and urban areas has relatively high elasticities. In terms of all meats (meat total), rural has a much higher elasticity than that in urban areas. Indeed, for all other livestock products (milk and milk products, eggs and fish), the income elasticities of demand are higher in rural areas. The fact that the elasticities of milk and milk products are higher than those of meats, eggs and fish suggests that there will be a more rapid growth in their demand when consumer income increases. Within meats, beef appears to be an inferior good in urban areas with negative income elasticities.
6. Growth in Animal Product Production and Availability, and Future Prospects
Earlier discussions have indicated that livestock product consumption has experienced increases in India in the past three decades or so. Also, India’s demand for livestock products will increase when consumer income further increases. In this regard, it is useful to also examine the supply of livestock products in India, and in particular, its future capacity to meet the likely strong demand for livestock products.
According to the production and per capita availability estimates by the Ministry of Agriculture, there has been substantial growth in the production of milk and eggs. Part A of Table 10 indicates a steady increase in both milk and egg production over the past 25 years. Milk production tripled to 97.1 million tonnes in 2005/06 from 31.6 million tonnes in 1980/81. During the same period, egg production more than quadrupled to 46 billion in 2005/06 from 10 billion in 1980/81. Per capita availability of both milk and eggs has also increased remarkably, reaching 241 gm/day for milk and 42 per year for eggs. Milk production was growing at 3.7% per year in the last 10 years, a slight slow down from the long-term growth rate of 4.3%. Per capita availability was growing at 1.9% annually during 1995/96 and 2005/06. In the case of eggs, production was growing at a steady rapid rate of 5.9% per year during the past ten years, and the per capita availability increased at 4.3% per year.
Table 10. Outputs of Livestock Products
Part A: Milk and Eggs, Production and per Capita Availability
Year |
Milk Production (m t) |
Milk Per Capita Availability (gm/day) |
Eggs Production (million) |
Eggs Per Cap Availability (No.) |
1980/81 |
31.6 |
128 |
10060 |
15 |
1981/82 |
34.3 |
136 |
10876 |
16 |
1982/83 |
35.8 |
139 |
11454 |
16 |
1983/84 |
38.8 |
147 |
12792 |
18 |
1984/85 |
41.5 |
154 |
14252 |
19 |
1985/86 |
44.0 |
160 |
16128 |
21 |
1986/87 |
46.1 |
164 |
17310 |
22 |
1987/88 |
46.7 |
163 |
17795 |
23 |
1988/89 |
48.4 |
166 |
18980 |
24 |
1989/90 |
51.4 |
173 |
20204 |
25 |
1990/91 |
53.9 |
176 |
21101 |
25 |
1991/92 |
55.7 |
178 |
21983 |
26 |
1992/93 |
58.0 |
182 |
22929 |
26 |
1993/94 |
60.6 |
187 |
24167 |
27 |
1994/95 |
63.8 |
194 |
25975 |
29 |
1995/96 |
66.2 |
197 |
27198 |
30 |
1996/97 |
69.1 |
202 |
27496 |
29 |
1997/99 |
72.1 |
207 |
28689 |
30 |
1999/99 |
75.4 |
213 |
29476 |
30 |
1999/00 |
78.3 |
217 |
30447 |
32 |
2000/01 |
80.6 |
220 |
36632 |
36 |
2001/02 |
84.4 |
225 |
38729 |
38 |
2002/03 |
86.2 |
230 |
39823 |
39 |
2003/04 |
88.1 |
231 |
40403 |
40 |
2004/05 |
92.5 |
233 |
45201 |
42 |
2005/06 |
97.1 |
241 |
46166 |
42 |
Growth rates |
||||
1980/81-2005/06 |
4.3 |
2.4 |
5.8 |
3.9 |
1995/96-2005/06 |
3.7 |
1.9 |
5.9 |
4.3 |
Source: Ministry of
Agriculture (2006).
Part B: Meat Production (‘000 tonnes)
Year |
Beef/ Buffalo Meat |
Goat Meat/ Mutton |
Chicken |
Pork |
Total |
1981 |
205 |
402 |
120 |
75 |
850 |
1982 |
210 |
430 |
130 |
80 |
865 |
1983 |
212 |
436 |
137 |
80 |
1010 |
1984 |
297 |
481 |
150 |
82 |
1047 |
1985 |
302 |
499 |
161 |
85 |
1106 |
1986 |
323 |
517 |
180 |
86 |
1261 |
1987 |
446 |
542 |
193 |
80 |
1630 |
1988 |
522 |
526 |
225 |
357 |
2974 |
1989 |
1781 |
545 |
289 |
359 |
3596 |
1990 |
2319 |
583 |
334 |
360 |
3710 |
1991 |
2361 |
623 |
362 |
364 |
3800 |
1992 |
2398 |
623 |
382 |
397 |
3950 |
1993 |
2632 |
635 |
599 |
469 |
4467 |
1994 |
2682 |
655 |
549 |
477 |
4494 |
1995 |
2716 |
663 |
624 |
495 |
4631 |
1996 |
2752 |
672 |
714 |
514 |
4785 |
1997 |
2743 |
680 |
648 |
462 |
4669 |
1998 |
2783 |
688 |
763 |
466 |
4835 |
1999 |
2820 |
694 |
875 |
473 |
4998 |
2000 |
2858 |
696 |
1136 |
476 |
5304 |
2001 |
2885 |
699 |
1307 |
483 |
5515 |
2002 |
2913 |
703 |
1460 |
487 |
5701 |
2003 |
2940 |
709 |
1662 |
490 |
5941 |
2004 |
2966 |
714 |
1515 |
497 |
6032 |
Growth rates |
|||||
1989-2004* |
2.3 |
1.5 |
11.7 |
2.0 |
3.4 |
1994-2004 |
1.0 |
0.8 |
11.8 |
0.1 |
3.1 |
* Calculated for 1989-2004 rather than 1981-2004 to exclude estimate changes in 1988-1989.
Source: Ministry of Agriculture (2006).
Part B of Table 10 provides a picture of meat production in the recent past. It is noted that there appears to be a change in the method of estimation of beef production around 1988-89 resulting in a large jump in the production estimate for beef. The same is true for pork around a year earlier. According to these estimates, beef holds the largest share of 51% of meat production, followed by chicken at 27%, goat meat/mutton at 13%, and pork at 9%. It may be noted that these estimates are at substantial variance with the demand distribution across these meats presented above, in which beef is a minor meat in consumption and goat meat/mutton have a larger share in meat consumption than chicken. This variance between production and consumption is because India is a substantial exporter of beef and pork to the countries in the region, and there is a cultural/religious taboo on the eating of beef and pork in India.
To exclude the estimate changes in the data in 1988-89, the growth rates have been estimated for 1989-2004 (rather than 1981-2004) and 1994-2004. In terms of growth rate, the estimates indicate that meat production was growing at 3.4% during 1989-2004 and slowed down slightly to 3.1% in the last 10 years. The slowing down is more pronounced in the production of beef, goat meat/mutton and pork. During 1994-2004, beef and goat meat/mutton production were growing very slowly at 1.0% and 0.8%, respectively. Pork production was hardly growing at all. Chicken production was the only one that continued to grow rapidly at 11.8%.
The above analyses suggest there has been strong momentum in the production of eggs, milk, and chicken meat. However, the growth in the production of beef, goat meat/mutton and pork has slowed down in the past 10 years or so. Nonetheless, given that India’s trade in livestock products have been very limited, it means that India’s consumption of animal products in the past years has been largely met by the supply from domestic sources. Then, will India’s own supply be adequate to meet the growing demand for animal products in the years to come?
To project what kind of scenarios may emerge in the future requires more parameters. Nevertheless, projections using indicative growth rates have been developed based on the analysis presented above, as shown in Table 11. The results indicate a rapidly rising demand for livestock products with the expenditure growing at about 10% per year in the near future based on the expected income growth rate and elasticities of demand. Milk demand may grow at about 10.6% per year, egg demand at 7.4% and meat demand at 8.4%. Against this, the production is growing at a much slower pace. Milk production is growing at 3.7%, egg production at 5.9%, and meat production at 3.1%. Except for the growth rate in chicken which somewhat exceeds the demand growth, large gaps are likely to emerge for many meats as well as in eggs and dairy products as economic development proceeds and demand for livestock products continue to increase.
Table 11. Projected Future Scenario of Annual Growth Rates for Livestock Products
Item |
Consumption Per Capita Per Month 2004/05 |
Income Elasticities of Demand |
Projected Demand Growth Rate |
Projected Production Growth Rate |
|||
Quantity (kg) |
Value (Rs) |
Quantity |
Value/ Expend. |
Quantity |
Value/ Expend. |
1994-2004 |
|
Milk, Liquid |
4.180 |
51.66 |
1.602 |
1.672 |
10.2 |
10.6 |
3.7 |
Milk Products |
- |
4.76 |
2.295 |
14.0 |
|||
Milk & Milk Products |
- |
56.42 |
1.730 |
10.9 |
|||
Eggs (nos.) |
1.190 |
2.12 |
1.136 |
1.138 |
7.7 |
7.7 |
5.9 |
Goat Meat/Mutton |
0.053 |
5.21 |
1.161 |
1.240 |
7.9 |
8.3 |
0.8 |
Beef/Buffalo Meat |
0.037 |
1.57 |
0.437 |
0.642 |
4.0 |
5.1 |
0.1 |
Chicken |
0.059 |
3.73 |
1.225 |
1.151 |
8.2 |
7.8 |
11.8 |
Meat Total |
0.158 |
10.98 |
1.066 |
1.162 |
7.4 |
7.9 |
3.1 |
Egg, Fish & Meat |
- |
21.10 |
1.072 |
7.4 |
|||
Livestock Products – All |
- |
77.52 |
1.510 |
9.8 |
|||
Total Food |
- |
342.99 |
0.791 |
5.9 |
|||
Note: The per capita consumption and income elasticities of demand are the weighted averages of rural and urban estimates with population as weights. The projected demand growth rates assume a national population growth rate of 1.6% and income growth rate of 7.0% based on recent past estimates.
Sources: Authors’
estimates based on NSSO (2007), NSSO (2001), Ministry of Finance (2007).
7. Conclusions and Implications
The findings of this study indicate a rapidly rising importance of livestock products in the demand for food in India. Examination of the National Sample Survey data shows that the consumer expenditure on livestock products has risen rapidly over the years and has now exceeded that on cereals in urban areas by the latest survey year of 2004/05. Analysis indicates that the major reason behind this is the substantially higher income elasticities of demand for livestock products as compared to other foods which lead to an expenditure increase of 1.67% in the rural areas and 1.04% in urban areas with every one percent increase in income. Our analysis also shows that within livestock products, milk and milk products hold a dominant share of 73%, while fish and eggs have much lower shares of 10.3% and 2.7%, respectively. Further, within milk and milk products, liquid milk holds a dominant share of 92%.
The income elasticities of demand also favour milk and milk products – data show that the rise in their demand from lower to higher income classes far out-paces the demand for other livestock products. Rural areas show higher income elasticities such as 1.82 for liquid milk and 1.29 for goat meat/mutton compared to 0.95 and 0.76 for urban areas, respectively. However, for chicken, the elasticity is higher at 1.25 in urban areas as compared to 1.21 in rural areas. The consumption and the elasticities indicate that the preference for beef/buffalo meat is low and it is an inferior good with an elasticity of -0.180 in urban areas.
India produces about 100 million litres of milk, 50 billion eggs, and 6 million tonnes of meat every year. Production estimates indicate a good growth for some of the livestock products in India. For example, the milk production, egg production and chicken production are showing annual growth rates of 3.7%, 5.9% and 11.8%, respectively, in the last 10 years. However, the growth rates for goat meat/mutton, beef and pork are very low. On the other hand, with the high income elasticities of demand, high income growth rates, and high population growth rates, the demand for livestock products may be expected to rise rapidly
To meet the fast growing demand for livestock products, it implies that India’s domestic supply will be hard pressed and much better production performance is required. Otherwise, imports may be required. Whether and how much more livestock products India can produce is yet to be seen. India’s rising demand for livestock products also has implications for, and raises challenges to, the broad international community. Can India produce sufficient livestock products to meet domestic needs? If not, what would be the likely shortage? How much will India need to import from the international market? If India does import livestock products or animal feeds, what would be the impact on the world prices of livestock products and on the world prices of feedstuffs? All these and other related issues warrant earlier attention from India and the broader international agribusiness community.
For Australia, its dairy industry may wish to closely monitor India’s needs for dairy products given that the potential increase for dairy products will be enormous if India’s consumer purchasing power further improves. Should Australia and India reach an agreement on bilateral free trade between the two countries, Australian dairy industry will benefit. Milk powder and other fine-processed dairy products are likely the major products to be exported to India. As far as the regions are concerned, the dairy product demand is the highest in the north and the west, particularly the northern states of Punjab and Haryana. More efforts from Australian dairy industry may be devoted to these regions when exploring markets in India.
Meat consumption in India is very low and is dominated by goat meat/mutton. Beef consumption still faces serious religious and socio-cultural taboo. However, beef consumption among consumers of non-Hindu religion is on the rise. Expatriates also consume beef. Tapping into niche consumer markets in India with reputable quality of Australian beef, though challenging, but should not be impossible.
References
Cranfield, J.A.L., Hertel, T.W., Eales, J.S. and Preckel, P.V. (1998), ‘Changes in the structure of global food demand’, Staff Paper 98-05, GTAP Centre, Purdue University.
Dastagiri, M. B. (2004), ‘Demand and supply projections for livestock products in India’, Policy Paper 21, National Centre for Agricultural Economics and Policy Research (NCAP), ICAR, New Delhi, India, March.
Gandhi, V. P. and Mani, G. (1995), ‘Are livestock products rising in importance? A study of the growth and behaviour of their consumption in India’, Indian Journal of Agricultural Economics, Vol. 50, No.3, pp. 283-293.
Gould, B.W. (2002), ‘Household composition and food expenditure in China’, Agribusiness, Vol. 18, pp. 387-402.
Guo, X.G., Mroz, T. A. and Popkin, B.M. (2000), ‘Structural change in the impact of income on food consumption in China, 1989-1993’, Economic Development and Cultural Change, Vol. 48, pp. 737-60.
Hirshleifer, J., Glazer, A. and Hirshleifer, D. (2005), Price Theory and Applications: Decisions, Markets, and Information, 7th edn, Cambridge University Press, Cambridge.
Jones, E., Akbay, C., Roe, B. and Chern, W.S. (2003), ‘Analyses of consumers’ dietary behaviour: an application of the AIDS model to supermarket scanner data’, Agribusiness, Vol. 19, pp. 203-221.
Ministry of Agriculture (2006), Basic Animal Husbandry Statistics, Government of India, New Delhi.
Ministry of Finance (2007), Economic Survey 2006-2007, Economic Division, Government of India, New Delhi.
NSSO (1976, 1979, 1985), The National Sample Survey: Tables on Consumer Expenditure, various reports/tables pertaining to: 25th Round (July 1970-June 1971), 28th round (October 1973-June 1974), 32nd Round (July 1977-June 1978), 38th Round (January-December 1983), Department of Statistics, Government of India, New Delhi.
NSSO (1991), The Fourth Quinquennial Survey on Consumer Expenditure: NSS 43rd round (July 1987-June 1988), Sarvekshana, Vol.15, No.1, Issue No 48, July-September.
NSSO (1997), Consumption of Some Important Commodities in India, NSS 50th Round 1993-94, Department of Statistics, Government of India, New Delhi.
NSSO (2001), Levels and Patterns of Consumer Expenditure in India, 1999-2000, Report no. 457, Ministry of Statistics and Programme Implementation, Government of India, New Delhi.
NSSO (2006), Level and Pattern of Consumer Expenditure, 2004-05, Report no. 508, Ministry of Statistics and Programme Implementation, Government of India, New Delhi.
NSSO (National Sample Survey Organization) (2007), Household Consumption of Various Goods and Services in India, 2004-05, Report no. 509, Vol. 1 & 2, Ministry of Statistics and Programme Implementation, Government of India, New Delhi.
Regmi, A., Deepak, M.S., Seale, J.L. and Bernstein, J. (2001), ‘Cross-country analysis of food consumption patterns’, in Regmi, A. (ed.), Changing Structure of Global Food Consumption and Trade, ERS WRS No. 01-1, USDA, Washington, D.C.
Sinha, P. and Giri, A.K. (1989), ‘Consumption of livestock products – analysis and comparison of data of NSS 32nd NSS 38th Round’, in Indian Society of Agricultural Economics (1989), Livestock Economy of India, Oxford and IBH Publishing Co. Pvt. Ltd., New Delhi.
Tian, W.M. and Zhou, Z.Y. (2005), ‘Urban foodgrain consumption’, in Zhou, Z.Y. and Tian, W.M. (eds), Grains in China: Foodgrain, Feedgrain and World Trade, Aldershot, Ashgate, pp. 65-86.
Timmer, C.P., Falcon, W.P. and Pearson, S.R. (1983), Food Policy Analysis, Johns Hopkins University Press, Baltimore.
Wang, J.M. and Zhou, Z.Y. (2005), ‘Animal product consumption’, in Zhou, Z.Y. and Tian, W.M. (eds), Grains in China: Foodgrain, Feedgrain and World Trade, Aldershot, Ashgate, pp. 87-107.
Zhou, Z.Y., Wu, Y.R. and Tian, W.M. (2005), ‘Rural foodgrain consumption’, in Zhou, Z.Y. and Tian, W.M. (eds), Grains in China: Foodgrain, Feedgrain and World Trade, Aldershot, Ashgate, pp. 42-64.