|
|
|
|||

Department of Agriculture and Food Systems
|
||||
|
||||
|
|
|
|||
Department of Agriculture and Food Systems
|
||||
|
||||
|
|
Agribusiness Review - Vol. 8 - 2000Paper 6 The Anatomy of Australia's Wine Boom: Lessons for Other IndustriesKym Anderson School of Economics and October 12th, 2000 Financial assistance of the Rural Industries Research and Development Corporation is greatly appreciated. Thanks are also due to Nicholas Berger, Robert Osmond and Glyn Wittwer for their collaboration on earlier papers, and to the SA Centre for Economic Studies, the Grape and Wine Research and Development Corporation and the Australian Research Council for supplementary financial assistance. The Anatomy of Australia's Wine Boom: Lessons for Other IndustriesThe rural sector's share of Australia's exports has been declining for decades. Having been above 60 per cent prior to the 1960s it was around 40 per cent in the 1970s but has been barely above 20 per cent in the 1990s (the same share as services and only two-thirds that of mineral resources -- see ABARE 1997a, 2000). Nonetheless, Australia's rural exports continue to expand in aggregate value and volume terms and, within that aggregate, some industries are doing much better than others. This raises the question as to what can be learnt from the successful cases. There is no more spectacular success story than the wine industry during the past decade or so. Nor is there a better time than now to improve the rural sector's export performance, for a number of reasons. Firstly there is an increasing demand for a greater variety of products as incomes grow globally. That is manifesting itself in, among other things, growth in demand for a wider range of exotic foods from foreign countries. One consequence is a rise in the share of processed food in global agricultural and processed food exports: that share rose from one-third in the 1960s to one-half in the 1970s, and it is now around three-fifths (Anderson et al., forthcoming). Specialization in production and intra-industry trade between countries in processed food (including beverages) is likely to continue to grow with incomes and with consumer exposure to exotic foods through travel, providing expanding opportunities for value-added rural exports (Antle 1999). Secondly, the bringing of agriculture under the disciplines of the General Agreement on Tariffs and Trade (GATT) will gradually free up world markets for both raw and processed farm products and allow increased exploitation of Australia's agricultural comparative advantages. Agriculture has been the most glaring exception to the general global trend towards lowering trade barriers over the past half century, but thanks to the Uruguay Round the process of reducing agricultural protectionism has at least begun. A new round of agricultural trade negotiations sponsored by the World Trade Organization (WTO) began in March 2000, so as to continue that process of farm trade liberalization. Thirdly, globalization of the world economy in general, even if it does not raise the rural industry's share of Australia's exports, can nonetheless continue to boost the absolute value of those exports, for example through the lowering of transport and communication costs. 1 How can Australia's rural industries take advantage of these opportunities to expand their export earnings? One way is to examine successful cases of export-led growth through adding value via processing primary products that are otherwise difficult to transport internationally. Value-added activities involve investing in more than just processing, however; also crucial are investments in marketing and distribution systems. Within Australia, there is probably no better recent example of export-led success than the wine industry. Wine exports have risen from less than $50 million pa in the mid-1980s to more than $1 billion in 1999, thanks to huge increases in production relative to domestic consumption. As a consequence, the volume of exports has risen from less than 5 per cent to more than 30 per cent of production, and will soon exceed 50 per cent. Those shares are even higher in value terms, because most exports are premium wines whereas only one-third of the volume of domestic consumption involves premium wine. Australia is now the world's largest wine exporter after the European Union bloc (or fourth after France, Italy and Spain), having been a net importer of wine as recently as the early 1980s. Yet barely a dozen years ago the government was paying winegrape growers to uproot their vines, so dire were the prospects for the industry perceived to be at that time. This paper examines the lessons that can be learnt from that industry and reflects on their relevance to other industries, using as examples olives and dairying. It begins by summarizing briefly the 150-year long history of Australia's wine industry, so as to put its boom of the 1990s in historical perspective and to contrast key features of the current boom with those of earlier ones. It then compares Australia with other significant countries in the global wine market to provide an international perspective on the expansion of the past decade. Some speculation is then provided on the potential sustainability of the industry's recent growth: are Australian grape and wine producers likely to experience another 'bust' soon? This is done by drawing on results from an economic model used to quantify the relative importance of the main factors contributing to the recent growth in wine output and exports. The final section draws out lessons for other industries in Australia. In particular, it explores the extent to which the olive and dairy industries might emulate the wine industry's success. How well has the wine industry performed over the past decade?While wine exports have boomed several times in the past, in each case those booms subsequently plateaued and the expanded acreage meant grapegrowers went back to receiving low returns. Indeed in the latter 1970s/early 1980s wine exports were so low that Australia became a net importer of wine, and the industry's prospects were sufficiently dire as recently as 1985 as to induce the government to fund a vine-pull compensation scheme to encourage grapegrowers to move to alternative crops. Yet, like a phoenix, the industry has risen again and grown with renewed vigour during the past decade: the real value of both winegrape and wine production has grown at more than 10 per cent per annum over the past dozen years; and nearly one-third of annual wine sales are now in export markets, up from just 2 or 3 per cent in the mid-1980s. The history of fluctuating fortunes raises the obvious question of whether the export-focused wine boom of the 1990s is to be followed by yet another crash, at least in winegrape prices if not in wine production and export volumes. The wine industry is still bullish, having in 1995 set itself targets of doubling annual exports to $1 billion by the turn of the century (since achieved) and of trebling the real value of wine production within 30 years. Others, aware of the boom-bust cycles of the past, still need to be convinced that this time the expanded demand is here to stay long enough for growers to recoup a return from the doubling in Australia's area of winegrape vineyards during the 1990s. To help resolve this difference in views, think first of what we can learn from the past. On the one hand, it is difficult not to be sobered by the past. This is because, as is clear from Figure 1, each of the first four booms in the Australian wine industry finished with a plateau in vineyard area (and winery output) growth -- periods when returns to grapegrowers and often also winemakers were depressed for years because of the extent of new plantings during the boom. Nor is this phenomenon unique to Australia. On the contrary, it has periodically been the case in grape and wine markets elsewhere in the world for at least two millenia (Unwin 1991). Figure 1: Area of vineyards, Australia and South Australia, 1849-50 to 1998-99
Source: Updated from Osmond and Anderson (1998, Table 2). Yet, on the other hand, our past history also is encouraging, because it shows the current boom to have several positive features that contrast with those of earlier booms. These are summarized in Table 1. The first boom, from the mid-1850s, was mainly driven by domestic demand growth following the gold-rush induced trebling in Australia's population in the 1850s. However, the wine produced from that excessive expansion was not able to be exported profitably, largely because of high duties on inter-colonial trade plus poor marketing and high transport costs in exporting the rather crude product of that time to the Old World. Hence returns slumped quite quickly in that first cycle. TABLE 1 : Summary Of Booms And Plateaus In Australian Wine Industry Development, 1849-50 to 1997-98
Source: Osmond and Anderson (1998). The second boom, from the 1880s, was due to a mixture of domestic and export demand growth, the latter involving better marketing and lower transport costs for what were higher quality but still mostly generic bulk (rather than winery bottled and branded) dry red wines. The relatively open British market absorbed one-sixth of Australia's production early this century, before the first world war intervened. That boom was part of a general internationalization of world commodity markets at that time something that returned but in much-diminished form after that war. The acreage boom induced by soldier settlement after World War I provided the basis for the third boom, from the mid-1920s. That third boom was helped by irrigation and land development subsidies, a fortified wine export subsidy, and a 50 per cent imperial tariff preference in the British market for fortified wines. The decline in domestic consumption, induced by the export subsidy and the Depression, added to wine exports in the 1930s which by then accounted for more than one-fifth of production (Osmond and Anderson 1998, Figure 4). The subsequent removal of the export subsidy, and the huge hike in UK tariffs on fortified wine in the latter 1940s, then caused a severe decline in export orientation. As well, the return to normal beer consumption after war-induced grain rationing kept down domestic wine sales growth. The fourth boom, following two post-war decades of slow growth in the industry, was entirely domestic. It emerged as Australian consumer tastes became more European, as licensing and trade practice laws changed with income growth, as corporatization of wineries led to more-sophisticated domestic marketing and new innovations (including casks, or wine-in-a-box), and as Britain's wine import barriers rose again with its accession to the EEC. Initially domestic demand grew for red wine. Then the cask attracted a new clientele of white wine drinkers, causing Australia's per capita consumption to more than treble during the fourth cycle. The recession of the early 1980s slowed demand growth and caused wine prices to slump to the point that the Federal and South Australian governments intervened with vine-pull subsidies in the mid-1980s. How does the fifth and latest boom, which began in the late 1980s, differ from the earlier booms? One difference is that the current boom is overwhelmingly export-oriented, since per capita consumption has been static over the 1990s. This contrasts with the first and fourth booms at least which were primarily domestic. It also differs from the inter-war boom, when exports were more a way of disposing of soldier-settlement induced surplus low-quality fortified wine production than as a pre-planned growth strategy. Secondly, the current boom is mainly market-driven, which is not unlike the first two booms but contrasts markedly with the third (inter-war) boom which evaporated once government assistance measures were withdrawn. In the present boom the only form of assistance offered and hence able to be withdrawn is the tax incentive to expand plantings via the tax-reducing accelerated depreciation allowance for some vineyard construction costs. Another major difference between now and the past is that the quality of wine output has improved hugely during the past decade or so. Moreover, for the first time, the industry is in a position to build brand, regional, and varietal images abroad to capitalize on those vast improvements in the quality of its grapes and wines. That image building has been partly generic, with the help of the Australian Wine Bureau's activities in Europe and elsewhere. It is coming also from the promotional activities of individual corporations and their local representatives abroad as those firms become ever-larger and more multinational via mergers and takeovers during the past dozen or so years. That will be supplemented in future with regional promotion, following the definition of geographical indications. All three forms of promotion have been helped by being able to point to the legislated wine quality standards in the Australian Food Standards Code. A fourth feature distinguishing the current situation is the health factor. An ever-wider appreciation of the desirability of moderate over heavy drinking, and in particular of the possible health benefits of a moderate intake of red wine, 2 are ensuring that the consumer trend towards spending on quality rather than quantity of wine (and on wine in preference to beer and spirits) will continue for the foreseeable future. And fifth, Australian wines are still exceptionally good value for money in Northern Hemisphere markets, despite the real price increases of the 1990s. The depreciation of the Australian dollar during 1997-98 and again in early 2000 has allowed that to continue. These are all reasons to be optimistic about Australia's long-term future as a successful exporter of premium wines. Within the next five years export sales could well account for the majority of Australian wine sold. How long the current boom lasts therefore depends heavily on export demand for Australian wine. That in turn depends both on the export marketing skills and efforts of the industry and on developments elsewhere in the world wine market. Australia's export-oriented wine growth in international perspectiveWith this in mind, it is helpful to consider such questions as: How does growth of Australia's wine production and exports compare with growth of global wine consumption and expansions by other New World wine producers? How well is Australia penetrating traditional and new wine markets abroad, both absolutely and relative to other exporters? And to what extent is Australia upgrading the quality of its exports to different markets, again both absolutely and relative to other exporters? Background to the global wine marketWine is still very much a European product. More than three-quarters of the volume of world wine production, consumption and trade involve Europe, and most of the rest involves just a handful of New World countries settled by Europeans (Table 2). In the late 1980s Europe accounted in value terms for all but 5 per cent of wine exports and three-quarters of wine imports globally. However, Europe's dominance is beginning to weaken. In the ten years to 1997, the rest of the world's share of wine export dollars rose ten percentage points, with virtually all of it coming from California and six Southern Hemisphere countries (column 1 of Table 3). When intra-European Union (EU) trade is excluded, the decline in Europe's share of global exports is even greater over that decade: a fall from 88 per cent to 70 per cent (column 3 of Table 3). Table 2:
a France, Italy, Portugal and Spain. Source: Berger, Spahni and Anderson (1999, Tables 5-7) and, for pre-1988 data, Berger, Anderson and Stringer (1998). Table 3:
a France, Italy, Portugal and Spain. Source: Berger, Spahni and Anderson (1999, Table 14). The rapid growth in wine exports from the New World over the past decade is ironic, in that it coincides with a decline in world wine consumption. Over the decade to 1997, global wine production and consumption fell at 0.8 per cent and 0.4 per cent per year, respectively, and yet global wine trade rose by 4.1 per cent per year in volume terms and 6.5 per cent in value terms -- or 9.7 per cent if intra-EU trade is excluded (final rows of Tables 2 and 3). Traditionally the countries producing wine were also the countries consuming it, with only about one-tenth of global sales being across national borders, and most of that was with near neighbours. The proportion traded rose a little over the 1980s but has since risen much more, so that now about one-quarter of the volume of sales is international (Table 4). That is, despite a slight decrease in the per capita volume of consumption globally, wine is becoming much more of an internationally traded product. This is reflected in the final column of Table 3, which shows production tending to outpace consumption in the wine-exporting countries and vice versa in the wine-importing countries. Trade is also becoming more inter-regional: in the late 1980s, 62 per cent of international wine trade was among the 15 members of the European Union, whereas by 1997 the intra-EU share was only 48 per cent (final rows of Table 3). Table 4:
a France, Italy, Portugal and Spain. Source: Berger, Spahni and Anderson (1999, Tables 5, 7 and 8). How well is Australia doing relative to other wine producers?In terms of global wine production, Australia has always been a small player. Prior to the 1970s it accounted for less than 1 per cent of world production, and as recently as 1987 its share had barely risen to 1.2 per cent. During the following ten years the share doubled, to 2.3 per cent, but on its own that statistic still makes Australia look rather insignificant. In terms of exports, Australia was even less significant until the 1990s. As recently as the first half of the 1980s the country accounted, in volume terms, for only 0.2 per cent of global wine exports, the same as its share of global wine imports. The import share has changed little, but the export share has shot up to 3 per cent in volume terms (Table 2) and 4.8 per cent in value terms (Table 3). In fact Australia's wine exports grew more than three times faster than the global average: at annual rates of 16 per cent in volume terms and 21 per cent in value terms over that period (Table 5). That was sufficient to ensure the industry reached its target of A$1 billion of wine exports in 1999. Table 5:
a France, Italy, Portugal and Spain. Source: Anderson and Berger (1999), based on raw data in Berger, Spahni and Anderson (1999). Rapid though Australia's export growth has been, it is not as fast as that for other Southern Hemisphere wine exporters, who as a group enjoyed a growth rate about ten percentage points faster (27 per cent p.a. for volume and 30 per cent for value in the decade to 1997). Nor was it much faster than that for North America or Europe's transition economies (columns 1 and 2 of Table 5). It is simply faster than that for Western Europe, which is still the dominant exporter group. Certainly Australia's comparative advantage in wine has strengthened as Western Europe's has weakened somewhat, as has that of other New World wine exporters. The final column of Table 4 indicates the extent of those changes. The final row shows that wine's share of merchandise exports has fallen for the EU from 2.1 to 2.0 times the global average, whereas for Australia that index has risen from 1.3 to 4.5 over the decade to 1997. The latter three-fold increase raises Australia's index to more than three-quarters that of the European Exporters, but it is a smaller proportionate rise than that for other Southern Hemisphere wine exporters, whose index rose from 0.4 to 2.5 over that decade. What is striking from the right hand columns of Table 5 is the different reasons for these high rates of New World export growth. Australia's exports grew rapidly because its production growth was much faster than its consumption growth. By contrast, in North America much slower production growth accompanied no growth in the aggregate volume of consumption. Meanwhile, in the other New World countries production actually declined, but much less so than domestic consumption, allowing exports to boom. Volumes of consumption per capita have become somewhat more equal across regions as a result but, as column 2 of Table 4 shows, there is still a wide variance. The world's top ten wine exporters account for 90 per cent of the value of international wine trade, with Europe's economies in transition from socialism accounting for most of the rest (left-hand column of Table 6). Of those top ten, half are in Western Europe and the other half are New World suppliers, led by Australia. Australia is the world's fourth largest exporter of wine in value terms, after France (alone accounting for more than 40 per cent), Italy (17 per cent) and Spain (9 per cent). The share of France has dropped ten percentage points since the late 1980s, which with smaller drops for Italy and Germany have ensured that Australia's and others' shares have risen substantially. Table 6:
a France, Italy, Portugal and Spain. Source: Berger, Spahni and Anderson (1999, Table 12). If the European Union is treated as a single trader and so intra-EU trade is excluded from the EU and world trade data, the EU's share of world exports shows a much bigger fall, from 82 per cent to 59 per cent in the decade to 1997. With that adjustment, Australia moves to number two in the world. Its share of global exports rises from less than 5 per cent to more than 9 per cent. It is this fact, in spite of Australia's small share of global production, which has made Australia suddenly a much more significant player in the world wine market. Meanwhile, the share of the other main New World exporters in Table 6 (Argentina, Chile, New Zealand, South Africa, and the US) rises even faster, from 6 per cent to 19 per cent. That is, while Australia has done very well as an expanding wine exporter, it is not alone: the world wine market as a whole is becoming more internationalized and far more competitive, and most key New World suppliers are expanding their export sales (albeit from a lower base) nearly as fast or even faster than Australia, as is clear from Figure 2. Figure 2 : Value of wine exports by major New World producers How well is Australia penetrating wine markets abroad?Just as exports are highly concentrated, so too are imports. The ten top importing countries accounted for all but 15 per cent of the value of global imports in the late 1980s. That 15 per cent residual had risen to 20 per cent by 1997, due mainly to Germany's reduced import share, indicating some growth of new markets. But more than half the value of all imports continue to be bought by the three biggest importers: the UK (with 21 per cent), the US and Germany (each with about 14 per cent -- see Figure 3). In volume terms, Germany is the largest importer of wine (19 per cent of the world total), followed by the United Kingdom (17 per cent), France (10 per cent) and the United States (8 per cent). Figure 3 : Share of world wine import value Despite that concentration, the ten top exporters are quite different in their penetration of those and other import markets. This is evident from Table 6. In Australia's case, it has concentrated on four English-speaking rich countries: the United Kingdom, the United States, Canada and New Zealand. When depicted as shares of Australia's total wine exports, it appears Australia has not diversified its exports much over the past decade: since 1993 those four countries have accounted for between 75 per cent and 85 per cent of Australian sales abroad. Certainly Australia has gradually increased its dominance as an importer in all four of those markets, especially the UK and US; but it has done so at the expense of boosting its shares in continental Western Europe (most notably Germany, the world's biggest importer of red wine) and in the emerging markets of East Asia (Figure 4). Figure 4: Australias share of value of wine imports by selected importing countries (per cent)
Figure 5 : Index of relative quality of exported wine How well is Australia doing in upgrading wine export quality ?A crude index of the quality of a country's wine exports is the average export price. To see how different exporting countries are faring relatively, Figure 5 shows each exporter's average price as a percentage of the global average, minus 100, at the beginning and end of the decade to 1997. While France's strong position has changed little, Australia and New Zealand have improved their positions hugely to rival the quality dominance of France's exports. New Zealand's average export price is well ahead of France's now, and Australia is just a few cents per litre behind France. Meanwhile, the price of exports from other Southern Hemisphere suppliers is now only half the Australian average. However, even though the Australian average unit export price rose 52 per cent over the decade to 1997 when the global average rose only 20 per cent, complacency is not called for. The rise for Australia was exceeded by Chile (55 per cent), Italy (59 per cent), New Zealand (61 per cent), and Argentina (63 per cent), and not far behind were the United States (44 per cent), South Africa (39 per cent) and even Europe's transition economies (31 per cent). Clearly, other new exporters are striving to raise the quality of their exports just as much as Australia, albeit from different bases. The global average increase was as low as 20 per cent mainly because the average price of exports from France and Spain rose little and, in Portugal's case, fell over the decade. How will trends in wine retailing alter Australia's export prospects?Another significant change emerging in the world wine market is the agglomeration of retail firms into giant supermarket chains (Geene et al. 1999). First in the UK, but now also on the Continent, the shares of large supermarkets (including the US giant Wal-mart) in the retail food and beverage market keep rising. Those wine retailers are able to market large volumes of uniform wine at low cost, which has contributed hugely to the growth in low-end premium wine sales globally. Their buying power is such, though, that they may choose to market more and more under their own brands, potentially depriving exporting countries of value-added activities beyond just producing wine per se. It is not certain as to the extent Australia will leave that lower end of the market to other countries and go further up in the premium range, but that is certainly the direction it has moved in recent years. What are the opportunities and challenges ahead for Australian wine producers?The absence of growth in demand for wine in aggregate, nationally and globally, need not in itself be a cause for concern. This is because the demand for premium wine has been growing rapidly, at the expense of non-premium wine, and Australia's production is being increasingly oriented towards higher-quality products. However, other New World producers are also upgrading the quality of their product, as are previously low-quality regions of traditional supplying countries (the south of France, La Mancha in Spain, northern Italy, Southeastern Europe). And the ever-strengthening retail giants in Europe are looking increasingly at own-brand packaging and marketing, which would lower the extent of high value-adding activities (bottling, labeling, marketing) in countries exporting at the lower end of the premium range. The key challenge for Australian producers is to remain internationally competitive in the wake of those export supply and retailing responses elsewhere. Where might the industry be by, say, 2003? A recent study by Wittwer and Anderson (1999) provides some projections using a model of the Australian economy (FEDSA-WINE, the model used to analyse alternative GST and wine 'equalization' tax options during 1998-99 for the WFA). That involves making use of macroeconomic projections plus projections of grape and wine supplies and demands. The domestic supply projections are relatively easy to 2003 at least because they can draw on the predictable grape supply effect of known actual and intended plantings in the late 1990s. Domestic and export wine demand growth is assumed to continue but at half the pace of the 1993-98 period. Two other important assumptions have to do with the exchange rate and the domestic consumer tax on wine. To test its effect on the results, first the assumption of no real exchange rate change between 1998 and 2003 is varied to allow a 10 per cent real depreciation. Then the base case is compared to a scenario in which the domestic consumer tax on premium wine is lowered from the rate of 48 per cent to 16 per cent (which is still double the average of rates in OECD countries -- see Berger and Anderson (1999, Table 2)). Table 7:
a (1) Base case (including no change in the real exchange rate, 1998 to 2003), as in Table 12. Due to the rapid projected increase in premium red grape production between 1998 and 2003, the export supply of premium wine is projected to escalate in this period. Premium red wine exports increase from 77 Ml in 1998 to 328 Ml in 2003, while premium white wine exports increase from 74 Ml to 130 Ml, with little change in non-premium exports. The increase of 250Ml of premium red sounds huge, but because Australia still supplies only a small fraction of global exports it represents a small percentage of world imports. For example, Germany by 2003 will be importing more than 1200Ml of mostly red wine, of which Australia up until now has supplied barely 0.3 per cent. Fully half of the projected increase in our red exports could be absorbed by Germany alone if Australia's share of that market were to be raised from less than 1 to 10 per cent (the same as for the United Kingdom in 1997). Two important assumptions in arriving at that base projection have to do with the exchange rate and the domestic consumer tax on wine. To test its effect on the results, first the assumption of no real exchange rate change between 1998 and 2003 is varied to allow a 10 per cent real depreciation. That real depreciation reduces projected growth in the domestic consumption of premium wine (c.f. columns (1) and (2) of Table 7). Premium red consumption reaches 91 Ml by 2003 instead of 95 Ml as in the constant real exchange rate case, while premium white consumption is 86 instead of 90 Ml and non-premium wine consumption is 263 instead of 267 Ml. Since a real depreciation also encourages domestic production of wine, the industry is projected to become more export-oriented. For example, premium red wine exports in 2003 are 28 Ml higher in this than in the base case. The real depreciation also reduces the decline in Australian dollar grape prices brought about by the massive increase in the supply of premium winegrapes. Premium red grapes are $44 per tonne higher in this than in the base case, premium white grapes are $35 per tonne higher, and non-premium grapes are $36 per tonne higher. Consumer prices for wine also are higher than in the base case. Premium red wine is $12.87 per litre, $0.65 higher than the base case, removing two-fifths of the base case price fall between 1998 and 2003. While production is higher by around 4 per cent for each wine type with the devaluation, much of the increase in exports is brought about through a smaller than otherwise build-up of premium red wine stocks (bottom rows of Table 7). Clearly Australia's export dependence looks set to grow rapidly, with the share of aggregate production exported projected to rise from 28 per cent in 1998 to 47 per cent in 2003 (slightly more with a devaluation, slightly less if the wine tax is lowered). For premium red the rise is even more dramatic: from 43 per cent to just over 60 per cent. To ensure these projected developments do not result in another slump in grape and wine prices, a number of strategies suggest themselves. One is to seek a reduction in the Federal Government's so-called 'wine equalization tax' (WET) of 29 per cent, which is to come into force on 1 July 2000 with the GST. That WET, together with the 10 per cent GST on wine, will generate much more tax revenue from the industry than currently (Anderson and Wittwer 1999), and will make Australia one of the highest taxing of the wine-producing countries in the world (Berger and Anderson 1999). As the above projections show, reducing that WET would reduce its future discouragement to domestic wine consumption (especially of premium wine, since it raises the consumer price of wine by more dollars the higher the wine's price), and thereby lower the volume of premium wine that would need to be exported. A second strategy is to continue to invest in the production and dissemination of new ideas in winegrape and wine production and in wine marketing and distribution. To date Australia has been a leader in wine R&D investments and in the rapid adoption of new technologies, which has given producers a significant competitive edge. The raising of the research levy on producers by more than one-third from 1999 will boost that tradition. However, Southern Hemisphere and Southern and Eastern European suppliers are catching up rapidly, including through international technology transfer. Australia is contributing to that in at least two ways. One is via Australian viticulturalists and winemakers exporting their services through spending time abroad as consultants (Williams 1995; Smart 1999). Another is via direct foreign investment (DFI) by Australia's bigger wine companies in grape production, wine making, and/or wine marketing and distribution in other countries. For example, Mildara Blass has planted more than 120 hectares to red wine grapes in the Napa Valley in California, Southcorp has its own vines and a joint venture on California's Central Coast, and BRL Hardy have a major winery (La Baume) in the south of France and a big joint venture in Sicily. These developments will help to keep profits of Australian-based multinational wine companies higher than they otherwise would be. However, eventually that will tend to put more downward pressure on the currently very high prices for winegrapes in Australia, since those wine companies would otherwise source grapes from growers in other countries and expand their wine production there. Even so, those individuals and firms so engaged as consultants and investors abroad are continually bringing back new ideas to Australia too, some of which could lower grapegrowers' and winemakers' costs of production or improve their wine marketing. Such international technology transfers are not peculiar to the wine industry of course -- it is part of the general contribution by multi-national corporations (MNCs) to globalization. That in turn has been aided by reforms to restrictions on DFI and by the fall in communication costs thanks to the digital/information revolution. The distinctive feature of this phenomenon is that successful MNCs have so-called 'knowledge capital' that is internationally mobile and hence tends to relocate to places where it can earn the highest rewards (Carr, Markusen and Maskus 2000). This has important consequences for Australian winegrape growers. During recent years they have enjoyed an exceptionally high proportion of the benefits of the growth in demand for premium wine, in the form of high prices for their grapes. Were those high prices to continue, large wine firms may find it more profitable to expand their crushing capacity in lower-priced countries rather than in Australia in the years ahead -- thereby causing winegrape prices to tend to equalize across countries, even though the grapes themselves are not traded internationally. Small winemakers also might be affected adversely in so far as the spreading abroad of Australian expertise in viticulture, winemaking and wine marketing eventually would reduce the distinctiveness of 'Australian' wine in the global marketplace. To repeat the previous point, however, there is the offsetting prospect that internationally engaged Australians will bring back new ideas that can be exploited here to good effect. A third strategy is to complete the definition of boundaries for the various regions and sub-regions ('geographical indications') so as to increase the payoff to producers in those regions from promoting their products on a regional basis, as a supplement to generic promotion at a national level. Recent empirical research suggests there is still considerable scope for Australia to gain from generic promotion in the United States at least, as its wines continue to attract lower prices than wines from Napa Valley that receive similar sensory ratings in magazines such as the Wine Spectator (Schamel 2000). Thanks to the WTO's trade-related intellectual property rights agreement ('TRIPs'), Australia is now able to register and get its own geographical indications recognised globally. The Schamel (2000) study also shows that equally rated wines attract different prices according to their regional origin (Napa being the highest in the United States), which suggests regional promotion is indeed effective in building reputation. Similar results have been found within Australia too (Oczkowski 1994). Australia was the first country to respond to pressure from the European Union to phase out the use of European names on wine labels. In return for signing the European Union-Australia Wine Agreement in January 1994, Australia now has less certification requirements to meet when exporting to the EU, and its wine is categorized there as 'quality' wine, a recognition of Australian blending rules. Because of that development, the Australian industry can now capitalize on its head start over other New World producers before South Africa, the United Sates and others catch up in this respect (Kok 1999). Corporate brand advertising will still remain the dominant form of promotion, but regional branding will add to 'Brand Australia' as an additional and more-specific means of generic promotion of the nation's wines. Domestically, better definition of regions also is leading to more information-sharing among producers, and to better coordination with wine (and food) tourism activities. A fourth strategy involves diversifying the destinations for Australia's exports as more exportable production comes on stream. The current narrowness of that distribution is clear from Figure 4, and from the fact that more than three-quarters of Australia's wine export earnings still come from just four English-speaking countries. Of course there are good reasons for low shares in some other markets. One is that the types and qualities of wine Australia exports may be not well matched with the types/qualities currently imported by some of the major importing countries. For example, France imports mainly low-quality wine (priced at one-quarter Australia's average export price), and the same is true for Europe's transition economies and, to a lesser extent, for the Netherlands and Sweden (Anderson and Berger 1999, Table 8). That is not the case in Japan though, yet Australia sells a very small proportion of its premium wine to Japan (while contributing a relatively high proportion of Japan's imports of other goods). This is probably due to Australia not being perceived by the Japanese as a super-premium supplier, having exported relatively low quality wine there in the early 1990s. Nor has Australia made much of an inroad into Germany, despite it being the world's biggest red wine importer. To date that has been because of insufficient premium red wine being available for export. As supplies expand over the next few years, the scope for high returns from further efforts in marketing and trade diplomacy in such countries will grow commensurately. At present Germany buys mostly from France and Italy. But since its red imports are more than ten times Australia's current premium red wine export volume, there is ample scope for that market alone to absorb all of Australia's expected output increase without reducing very much German imports from other EU countries or Australian producers' prices. Fifthly, attention needs to focus as well on the numerous barriers to wine imports abroad. Fortunately, a new round of agricultural trade negotiations is getting under way at the World Trade Organization (WTO) in 2000. That provides an opportunity to expand market access through the lowering of tariff and non-tariff import barriers, including through such trade facilitation measures as harmonization of standards. Import tariffs themselves are not very large except in East Asia (Berger and Anderson 1999). However, Old World fears of growing competition in the European and East Asian wine markets from New World suppliers could lead to the provision of more subsidies and protection via non-tariff measures by the European Commission. Already recent subsidies to producers in the EU to help upgrade their wine industry are reputed to be of the order of US$2.3 billion, over which negotiations could be targeted. There is also the possibility that the Uruguay Round agreements on Technical Barriers to Trade, on Sanitary and Phytosanitary Measures, and on Trade-Related Intellectual Property could be abused to provide hidden forms of protection to the EU industry. History shows that governments can be persuaded to use such covert protection when more obvious forms are being phased down, including in the wine industry -- see, for example, what happened in Canada after the signing of the Canada-US free trade agreement (Heien and Sims 2000). As well, it needs to be kept in mind that a tax on wine consumption in a country that does not produce wine is equivalent to an import tax. Should consumption of wine be taxed more heavily than that of other drinks on a per litre of alcohol basis in such importing countries, as occurs in some East Asian countries, a case could be made that this is a form of import barrier that violates Article III of GATT on national treatment of internal taxation (whereby consumption of a foreign (in this case alcoholic) product is taxed more heavily than a domestically produced 'like' product). National treatment also may be violated in the United States where the wine sales of smaller domestic wineries are taxed at less than the normal rate whereas imported wine are all taxed at the normal rate regardless of the size of the foreign winery producing it. New World wine exporters need to develop ways to make the most of the opportunity to become active participants, for the first time, in the next WTO round of multilateral trade negotiations. While each of those suppliers alone is not a very big player in the world wine market, their combined share of the value of global wine exports (excluding intra-EU trade) is 29 per cent, which is a sizeable counterweight to the EU's share of 55 per cent (column 3 of Table 3). It thus makes eminent sense for them to form a coalition for the purpose of dealing with the EU, including in multilateral negotiations. That was done recently, in the form of the New World Wine Producers' Forum that involves officials and wine industry representatives meeting twice a year (Battaglene 1999). Building up that new informal institution, by drawing on the huge success during the Uruguay Round of the Cairns Group of like-minded agricultural-exporting countries, is likely to have a high payoff during and beyond the next round of WTO trade talks. Lessons for Australia's grape and wine industryIf Australia's wine industry were to do no more than produce wine from the current vineyards with available technology, its profitability would almost certainly decline over the next few years as the quantity and quality of wine from other countries keeps rising in the international wine market. In that case the current boom would, like those in earlier times, be followed by a bust'. But the Australian wine industry is now far too dynamic and modernised for that to happen. It is much more export-oriented and market-focused than even before. Furthermore, the growth in demand for premium wine around the world, in part for health reasons, shows no sign of slowing and so will continue to absorb large increases in supplies of premium (as distinct from non-premium) wine. And the marketing and distribution networks established by Australian wineries are proving to be highly effective in exploiting niches in markets abroad. Generic Brand Australia' and now also regional promotion are adding to that marketing success by firms. What does all this suggest in terms of lessons for wine and other industries? A study of 35 small industry cases by Wood, Chudleigh and Bond (1994) found that by far the most important positive contributor to farm production growth was agricultural R&D and/or the ability to borrow farm technology from abroad. Beyond the farm gate, developing market opportunities (including through promotion), improving product quality, and being aware of one's competitors were seen as crucial. Ingredients that were thought a priori to be important but in practice did not seem to be essential for success were the involvement of large companies, a short payback period, and geographic concentration of producers. A more-recent study led by Hyde (1998) takes a broader perspective that includes more explicitly the value-added activities of processing and marketing. That broader approach is essential in cases such as wine where the farm product (winegrapes) is merely an input that is not easily traded internationally. Hyde suggested a crucial ingredient is a set of committed, hard-working entrepreneurs to champion the industry who need to: identify new opportunities through market research; ensure the right locations are being used for production and processing; develop long-term (15+ years) strategic and financial plans; continually import or develop technological know-how and be hungry to access and contribute to the latest technical developments; take the necessary investment risks with a sharp focus on quality in primary production and processing and on imaginative marketing; and encourage others to follow. The way the wine industry has developed is not inconsistent with those findings. Six characteristics in particular are worth mentioning, as follows. Identify new market opportunitiesThe modeling work reported above suggests that the predominant cause of the boom in wine production and exports has been the growth in export demand. The domestic demand swing towards premium red wine explained only one tenth of the growth in output of that wine type, and the raising of the tax on domestic consumption of wine also had a relatively small impact (negative for output, positive for exports). The success of those large firms in providing wines that cover a wide spectrum of quality, including the large-volume lower end of the premium quality (ie, bottled) range, is a reminder that attaining higher quality is not an appropriate goal per se. Rather, the goal should be providing a product that is desired by consumers because it is seen as 'good value for money'. Australia certainly has the technical capacity to produce some ultra-premium wines, but the skilled labour-intensity of that activity is so great as to make it difficult to cover costs even at high per bottle prices. Presumably the main purpose of such star performers is to market the company's lesser wines: it raises the profile of the brand, allowing the brand's premium and super premium types to sell at slightly higher prices than otherwise. The timing of the initial export surge was helped by the devaluation of the Australian dollar in the mid-1980s, which was due to a sharp fall in prices of Australia's coal, grain and other primary products. That devaluation, together with low domestic prices for premium red grapes at the time (due to a domestic fashion swing to whites from the mid-1970s), increased substantially the incentive for investing in developing overseas markets for Australian wine. Other factors expanding foreign demand for Australian wine at the time were food-safety scares associated with Chernobyl in April 1986 and scandals involving additives in Austrian and Italian wines (Rankine 1996). Meanwhile, competition was minimal from South Africa because of anti-apartheid sentiment and from Argentina and Chile because their domestic and trade policies for a long time had discriminated against agricultural producers. Given the growth in wine demand in the UK in particular, why did Europe's traditional wine exporters not cater more to that market? Australia's share of the value of the UK's wine imports between 1988 and 1997 grew from 2 to 10 per cent, while the share of the four traditional West European exporters fell from 78 to 65 per cent and that of Central and Eastern Europe remained flat at less than 2 per cent (Berger, Spahni and Anderson 1999, p. 90). It is understandable that exports from the economies in transition from communism have yet to be dramatic, given the myriad adjustment difficulties producers face in those countries. As for the European Union producers, they have been slow to respond because of the Common Agricultural Policy (CAP). The CAP has insulated EU producers from market forces, making it less profitable for them to respond to changes in consumer preferences. Specifically, the CAP has provided such high prices for non-premium EU wine (largely destined for distillation, as its direct demand has slumped) that they have not found it worthwhile to make the considerable investments necessary to upgrade their product and to market it abroad. True, some policy reforms have been introduced via the CAP's Agenda 2000, but the changes are expected to have only a minor effect (Tracy 1998). More likely to lead to export growth are (a) the regional funds being paid to support the upgrading of vineyards in places such as La Mancha in Spain (which involves grafting premium varieties onto old vines and introducing irrigation for the first time); and (b) some mimicking of the Australian response, which has occurred in Southern Europe where appellation controls are less (thanks mainly to investments such as at BRL Hardy's La Baume winery in the south of France, which is now exporting much of its production of low-priced premium wine to the UK). These two phenomena will certainly add to Australia's competition in the coming decade, but by how much is difficult to tell at this stage. Finally on market opportunities, the wine industry saw in the transformation of consumer tastes in the 1980s the scope for developing wine (with food) tourism. This offered scope for not only boosting consumer knowledge but also for lucrative cellar-door sales, especially for smaller boutique wineries. This high value-added part of the industry has flourished in the past decade or so, with lots of spillovers for regional Australia (Sutton 1999a). Activities range from classical and jazz music concerts to food and wine festivals in vineyards and wineries and to the Tour Down Under international bicycle race through the grape-growing regions surrounding Adelaide in January 2000. Such is the size of this activity that large wine tourism conferences are now held annually. Develop a long-term vision for sustainable growthGiven the above factors whose coincidence helped launch the export-led boom, what other attributes have been responsible for sustaining Australia's wine industry's growth through the 1990s? Hyde's champion entrepreneurs again can take some of the credit, this time for developing and launching a long-term strategic plan called Strategy 2025 (see AWF 1995). It was developed with nothing more in mind than providing a 30-year vision for the future so as to stimulate a steady flow of investment. At the time those targets were considered by many observers as rather optimistic, since they involved a three-fold increase in the real value of wine production, 55 per cent of it for the export market. Getting half way to those targets requires having a crush of 1100 kt to produce 750 million litres of wine at a wholesale pre-tax value of $3 billion ($4/litre) in 1995-96 Australian dollars. So convincing was that document (helped by the provision of tax incentives to high-income investors in the form of accelerated depreciation of vineyard construction costs), and so intense has been the subsequent investment (see Figure 1 above), that the industry has virtually reached that half-way point towards its 30-year target -- that is, in just five vintages! Crucial to sustainable growth is the need to anticipate and respond appropriately to the emergence of competitors. A good example of that in the 1990s was the need to adapt to the growth of Chilean wine exports to the UK and elsewhere. With the opening up of its economy, Chile's lower labour costs gave it a comparative advantage in the lowest-priced end of the market for bottled wine (under 4 Pounds Sterling), so Australia has moved up a rung on the quality ladder. As the newly planted vineyards in the river-irrigated areas come into production and grape prices fall, however, Australia may well be able to re-inhabit that low end of the bottle market as well. Continual and rapid adaptation to changing market circumstances will be an ever-more important attribute alongside the long-term strategic planning of successful firms as we move into the 21 st century. An important ingredient for long-run strategic planning is a constantly updated statistical database that captures developments at home and abroad. The smaller an industry, the less likely such data will be cheaply available. Yet for industries with long lead times and large up-front costs such as grapes and tree crops like olives, information on planting intentions of others in this country and elsewhere is especially pertinent for those contemplating investing, given that full bearing may not occur until 5+ years after beginning to invest. The grape and wine industry recognised this and spent some of its R&D funds on commissioning (a) the ABS to collect more information including on growers' planting intentions in the coming year, and (b) ABARE to use that information to project supplies five years ahead (see, e.g., ABARE 1997b). Also crucial for long-run strategic planning by firms and the industry is an active system of producer organisations. The grape and wine industry has an excellent system involving more than 80 organisations at the national, state and regional levels, with a well-developed hierarchy of interaction between them (see www.wineaustralia.com.au/organisations$_organisations.htm ). Among them is the Australian Wine and Brandy Corporation with its Australian Wine Export Council. One of its tasks is to ensure that exported wine meets the product standards of the importing country, so that the reputation of the industry as a whole is not jeopardised by any sub-standard shipments. Another is to supervise the Label Integrity Program. A third is to establish the regional boundaries for the purpose of registering Geographical Indications. And a fourth is to lobby directly and via the Department of Foreign Affairs and Trade for greater market access abroad through a lowering of tariff and non-tariff import barriers. Attract the necessary resourcesThe one other critical input is water. As it happens, vines need relatively very little water per year once they are established; yet having that water is essential for producing quality winegrapes every year over the long term. That means the industry has been able to afford to pay much more than many other rural users for water rights (eg four times as much as graziers wishing to irrigate pasture -- see Smith 1998, Table 3.6). Partly as a consequence of demands from the booming wine industry, major improvements to water property rights and water policies have been introduced over the past fifteen years. That has allowed investors in vineyard expansion to obtain the necessary water from other users. Invest in new production and processing technologiesAustralia has had a long history of investing in formal grape and wine research, education and training, dating from the establishment of Roseworthy Agricultural College (now part of the University of Adelaide) in 1883 and of its Diploma in Oenology in 1934, plus the creation of the Australian Wine Research Institute adjacent to the University of Adelaide's agricultural research campus in 1955 (Halliday 1994 pp. 109-11). In that same precinct, but involving several interstate participants as well, is a Cooperative Research Centre for Viticulture. And the industry since 1991 has had its own Grape and Wine Research and Development Corporation (see www.wineaustralia.com.au/organisations$_research.htm ). Its current budget is over $10 million per year, and growing rapidly not only because output is expanding but also because in 1999 growers and wineries agreed to raise the research levy by more than one-third. The Federal Government matches producer levies dollar-for-dollar. Rankine (1996) claims that even though Australia has supplied less than 2 per cent of the world's wine until very recently, it contributes 20 per cent of the global flow of research papers on viticulture and oenology. Much of that research involves the adaptation for Australian conditions of technologies and plant varieties imported from abroad. Formal education in viticulture and oenology has spread from the University of Adelaide to Charles Sturt University. Also, the University of South Australia and several other universities are now getting involved in wine marketing. As well, numerous Technical and Further Education campuses are offering vocational training both for employees and for boutique vineyard/winery proprietors and hobby farmers (see www.wineaustralia.com.au/organisations$_education.htm ). Having such a long history of applied research and associated post-secondary education and training courses, the industry has been able to remain at the global frontier of wine research and technology. More than that, it has been able to successfully export its technologies both via individual consultants operating abroad (Williams 1995), and via the larger companies becoming multinational through direct foreign investment in other wine-producing countries. Both types of export are desirable from a national viewpoint, even though they may lead to lower winegrape prices in Australia as others emulate this country's successes. The role of the grower liason officers employed by the wineries to interact with contract growers, in disseminating new information and helping to appraise grape quality, has been considerable. Those officers now insist on the use of diaries to record irrigation, spraying and fertilizing activities, they encourage lower yields so as to intensify grape colour and flavours, and they help monitor baume (sugar) levels in the grapes. In short, 'precision viticulture' is being adopted as producers strive for quality improvements (Polkinghorne 1999). Invest in product differentiation via promotionThe industry's own Label Integrity Program, together with its moves to define regions precisely through its Geographical Indications Committee and to change descriptors in response to the agreement with the European Union to phase out European names for wine types (Kok 1999), will all add to the marketability of Australian wines as consumers become ever-more sophisticated. That image building has been partly generic, with the help of the Australian Wine Bureau's activities in Europe; but increasingly, especially since the late 1980s, it is coming also from the promotional activities of individual firms and their overseas representatives. Some firms have done that by becoming ever-larger and more multinational via mergers and takeovers; other, smaller ones have joined forces informally and/or hired distribution agencies who through pooling can reap sufficient economies of scale. A non-trivial part of generic wine promotion has involved the positive projection to consumers of wine of it being a healthy product associated with an attractive lifestyle (Sutton 1999b), and of its production being environmentally friendly (Bowes 1999). Larger firms have added to the latter image, most notably BRL Hardy with the ecological park on their Banrock Station property in South Australia's Riverland. More-general generic promotion activities aimed at boosting domestic demand have included the huge Wine Australia expos every second year, alternating between Sydney or Melbourne, and the building of the new National Wine Centre adjacent to Adelaide's Botanical Gardens, to open in 2000-01. Establish good relationships between growers and processors/marketersAs with so many horticultural products, processing and marketing of winegrapes are needed before the product reaches the final consumers. For many winegrape producers, they have chosen to do some or all of those manufacturing and service activities themselves. But there are far more winegrape growers than there are wineries, with the former depending heavily on the latter to process their highly perishable and virtually non-tradable product. This has not been an issue during the past dozen years when winegrape demand has grown much faster than supply. Should that reverse in the next few years, as widely expected, the vulnerability of the grower will return. Not surprisingly, the shortage period has led to the widespread signing of long-term (often ten-year) contracts, providing wineries with security of supply in the 1990s and growers with greater security of demand into the next decade. The apparent maturing of the grower/processor relationship (see Hoole 1997 and Steiner 1999) has yet to be tested during a downturn in winegrape prices, but participants are optimistic that there will not be the same degree of acrimony in the future as there was in the past. One reason for that view is the greater quality and diversity of the raw material now being produced, and the way that is tied to a winery through its past investments in promotion of its wines and its viticultural advise to its growers. That tie encourages winery liason officers to continue to visit contractees' vineyards through the growing season to ensure the product is grown appropriately. As well, means of measuring the quality of grapes delivered for crushing are improving so there is less uncertainty about the appropriate bonus or discount that should be applied to the indicator price per tonne, and hence more incentive for growers to aspire to higher-quality production. The use of a 30-point system for grading grapes by Australia's biggest wine producer is an important symptom of this change (Steiner 1999, page 130). Continue to collaborate and speak with one voiceAs is evident from the above, there has been a great deal of collaboration among participants in the wine industry, particularly during the past dozen or so years. Nowhere was this more noticeable nor more crucial than during the debate over how wine would be taxed when the goods-and-services tax reform package was eventually introduced in July 2000. But it touches every major dimension of the industry. Marsh and Shaw (2000) highlight three key dimensions that have been deliberately cultivated: internationalisation (the export push), innovation (the expanding commitment to R&D spending), and a shared vision (Strategy 2025). The continuing commitment of industry participants to such collaboration is evidence that firms judge it to add value to their firm's operations. Lessons for other Australian industriesTo illustrate how the above contributors to the wine industry's success can help in identifying the potential scope for emulation by other industries, consider briefly two Australian rural industries with some similar characteristics: first the tiny olive industry, and then the far bigger dairy industry. Australia's olive industryOlives are an obvious product to draw parallels with wine. Like wine, olives are Mediterranean-based, more than two-thirds of global production and consumption take place (with considerable subsidization) in Europe, and they are well suited to the Australian climate and lifestyle. Furthermore, they are consumed often in ways that complement wine and, like wine, olives and olive oil are sold over a wide price range according to quality and taste preferences. New large-sized groves using mechanical harvesting may offer opportunities to exploit economies of scale, but will the olives so produced be of the quality sought by consumers and hence by processors and at a price that allows the processors to match comparable imports? The answer to that depends in part on the extent to which processing firms themselves are able to improve their productivity in both manufacturing and marketing/distribution. Even if they have the capacity to become much more productive, eg through exploiting economies of scale as the industry expands, it is not obvious that their focus should be on the domestic market alone. On the contrary, it may be that -- as is true of the wine industry -- the Australian olive producers' competitive niche covers a different segment of the quality spectrum than that which characterizes the Australian consumer market. (In the case of wine, premium wines account for less than one-third the volume of domestic sales but more than four-fifths of exports, and all of the expansion in vineyards and winery capacity has been geared towards export markets. Yet within the premium range, Australia's strongest comparative advantage has been above the bottom rung dominated by the likes of Chile but below the top rungs dominated by France.) Third, while most of the resources necessary for developing the olive industry are readily available, they need to be competed away from other uses. The tax incentives to plant olive groves are no more attractive than for planting grapes or fast-growing blue gums, for example. And at present prices olives have difficulty competing with grapes for land and water. Nor is there a large stock of knowledgeable producers who have been in the industry for generations, or a well-developed set of tertiary courses for training future generations (as there is for viticulture, oenology and wine marketing). That is not to say such courses could not be developed, but they would have to begin virtually from scratch and the numbers enrolling may be too small to make courses viable. Fourth, and closely related to education and training, is the paucity of past investment in olive research and development for Australian conditions and the associated dissemination or research findings. The wine industry has been making such investments for more than 150 years, in the form of on-farm selecting of varieties for different locations and exploring through trial-and-error. More-formal scientific grape and wine research investment has been substantial and systematic for at least the most recent 50 of those years, which has put Australia's wine industry at the technological frontier globally. By contrast, Australia's olive industry is still in its infancy in, for example, variety selection for different growing regions. Should large olive production and processing corporations emerge, they will be able to invest in at least adapting research findings from abroad and doing their own within-firm R&D. Failing that, a grower and processor R&D levy system like that for grapes and wine needs to be introduced and relied on to gradually build up the stock of pertinent knowledge. Initialy that fund could be administered by the Rural Industries Research and Development Corporation; and under current policy it would attract a WTO-consistent dollar-for-dollar subsidy from the Federal Government. Fifth, much larger investments in marketing, including quality assurance programs and promotional activities, have already been identified by McEvoy, Gomez, McCarrol and Sevil (1998) and McEvoy and Gomez (1999) as being needed for the olive industry. Those authors' surveys have identified relatively low level of knowledge by Australian consumers about most attributes of olive products. Given the growing interest in using those products, this suggests considerable scope for high payoff investments in marketing if and when sufficient volumes of appropriate olive products become available. And finally, as with wine, there is a great need for olive growers and processors/marketers to work together as a team for industry growth to be sustained. Vertical integration of the production stages is one obvious route for achieving that synergy but, as the wine industry has demonstrated, it is possible to have specialized firms at each of the different stages so long as there is good communication between the various links in the production chain. A long-term contract between the grower and processor is one way of assisting that process. Moreover, collaboration on all the key dimensions of the industry (including such things as quality standards, R&D funding, generic promotion) could well enhance the profits of industry participants. In short, relatively new industries such as olives have much to learn from the recent spectacular success of more-established wine industry. The latter has shown that dramatic export-led expansion is possible, but not without substantial hard work and large synergistic investments of time, effort and money in all three stages of the production process (primary production, processing, and marketing/distribution), and a great deal of collaboration among all key stakeholders. Australia's dairy industryThe dairy industry is Australia's third largest agricultural industry after beef and wheat, and nearly four times as large as winegrapes in terms of gross value of farm production. Like the wine industry, the dairy industry comprises farmers producing a primary product (unprocessed milk) that is not consumed directly but rather the dominant input used to manufacture a set of processed products (various varieties of liquid and powdered milk plus myriad milk-based products dominated by butter and cheese). Health regulations effectively prohibit the sale by farmers of unprocessed milk directly to final consumers, and economies of scale in pasteurisation, packaging and marketing are such that even liquid milk to nearby towns is supplied via large processing plants. Australia produces just 3 per cent of the world's milk (the same share as wine). With these dramatic changes in the Australian dairy industry, and with low-cost New Zealand becoming ever-more competitive as it too is deregulated, a great deal more restructuring of dairy farms, factories, and industry organizations is inevitable in the years ahead. To facilitate that process, entrepreneurial leadership, a long-term vision, and innovative strategies are needed. The wine industry's success suggests a number of strategies worth considering. First, evolving market opportunities need to be identified and reinforced. Demand in both Australia and other rich countries is growing fastest for high quality specialty dairy products, particularly non-cheddar cheeses, and for reduced-fat products including liquid milk (already more than one-quarter of Australia's domestic milk consumption). Currently Australians consume about 11 kilogrammes of cheese per capita, but nearly one-fifth of that is imported (two-thirds of which comes from New Zealand); and only one-third of Australia's cheese production is exported. Both domestic and export sales of specialty cheeses should be able to be expanded as sales of premium wines grow, given the strong complementarity between wine and cheese consumption. Promotion efforts to achieve that could include not just generic promotion domestically via the Australian Dairy Corporation but also regional generic promotion to supplement proprietary brand advertising. Opportunities for regional product promotion are growing as wine tourism expands and embraces local food as a complementary feature of each wine-producing region. Even geographical indications could be developed for dairy products in a similar way to those currently being finalized for wines (see AWBC 1999, pp. 58-59). A related aspect of strengthening the demand for Australian dairy products involves fighting for reductions in assistance to dairy production abroad. Doing so in the past always smacked of hypocrisy when Australia protected its own dairy industry so heavily. In any case it may not have been a high payoff activity nationally given the small share of Australian production that was exported and the small share of those exports in world dairy trade. The removal of Australia's protectionist and regulatory measures has changed all that: exports are now far more significant for the Australian industry, and will become moreso in the years ahead. By joining with the deregulating, export-focused New Zealand industry (see www.nzmilk.co.au ), these two suppliers of half the world's dairy exports have the moral high ground for pushing for cuts to dairy protectionism and export subsidies in the up-coming multilateral farm trade negotiations getting underway in 2000 at the World Trade Organization. Developing an appropriate trade policy strategy is a clear priority, and the Australian Dairy Industry Council has begun working towards that end during 2000. The move in 2000 to consider merging the New Zealand Dairy Board and Australia's second largest dairy producer and exporter, Victoria's Bonlac Foods Ltd, is a recent example of concentration continuing to happen (see www.nzmilk.co.nz/newsroom ). Coincident with that concentration could be a proliferation of boutique processors, focusing for example on specialty cheeses in wine tourism regions. As in the wine industry, such small firms can make a significant contribution at the regional level even if they account for only a small fraction of the industry's overall output. Third, there are on-going and new opportunities also for dairy farmers to lower their production costs per dollar of output. Expanding their land area and herd size will be somewhat easier under the provisions of the Dairy Industry Adjustment Program ( www.afta.gov.au/diap) , allowing further exploitation of economies of scale on the farm. In addition to lowering their production costs, dairy farmers -- like winegrape growers -- could raise their profitability also by negotiating with processors for better-defined quality attributes that can then attract more finely-tuned price premiums. In that way, as in the wine industry, farmers will become better able to respond to changing market conditions, thereby boosting the profitability not only of farms but also of processing plants. Fourth, investments in technological innovation, both for the farm and for processing, are likely to have higher payoffs in a less-regulated environment where incentives for change are less muted. To that end it may be worth evaluating the payoff from expanding levy payments to the Dairy Research and Development Corporation. Another low-cost source of inovation ideas is via foreign direct investment. For example, New Zealand producers investing in Australian farms are helping to expose farmers in Australia to the latest innovations in production. The same could happen following mergers with foreign processors. A further stimulus to investment in R&D will come from expected reforms to water policies in Australia. The scarcity value of water is well above the price currently facing irrigators, so when its effective price rises with the reforms the least profitable uses of water will cease. As it happens, irrigating pasture is one of the least profitable ways we currently use this scarce resource, far lower than for viticulture or horticulture. Hence over time, as water use charges rise, the dairy industry is likely to find it increasingly more profitable to substitute grain-based feeds in place of irrigated pasture. Importing, adapting and adopting intensive-feeding technology in anticipation of that change would then have a high payoff. A consequence of moving to more intensive feeding will be a reduction in the seasonal variation in production, making it easier for processors to handle the raw milk intake with less storage facilities per litre handled. Fifth, the relationship between dairy farmers and milk processors needs to be strengthened so as to better ensure that market signals received from consumers by processors are more efficiently passed back to farmers. To the extent consumers are willing to pay more for higher-quality products, and the attributes required of raw milk to supply that higher quality are quantifiable, then farmers will be able to boost both their and processors' profits more the more appropriate are the price differentials for different qualities of milk. As has been the case with wine, the need for such fine-tuning of grower incentives will strengthen and the volume and diversity of dairy export markets grow. These incentives need to be incorporated into medium- or long-term contracts between farmers and processors, now that milk prices are to be market-driven rather than administered. In summary, the dairy industry is poised to build on its remarkable achievements of the past decade or so as the last stage of deregulation proceeds and has the potential to become another export-led success story for Australia. According to a recent Senate enquiry (Australian Parliament 1999, page 3), once the domestic market is deregulated Australia will have the world's least protected dairy industry, ahead even of New Zealand (which retains a single desk approach to exports and still enjoys preferential access to the British market). As water policy reforms proceed Australia may not enjoy milk production costs as low as New Zealand's, but it could become a stronger international competitor nonetheless, particularly if it heeds the lesson from wine that marketing and distribution networks in export markets can make all the difference. Much more than winemakers, however, dairy industry leaders will have to invest hugely in commercial diplomatic efforts to lower assistance to dairy farmers in other countries, especially in Europe and North America, at the same time as improving the marketing of their produce in East Asia and elsewhere. References
Footnotes1 - Globalization refers to the fact that the world is becoming ever-more integrated. During the 1980s and 1990s especially, domestic and trade policy reforms, the freeing up of financial and foreign exchange markets, and the digital revolution have all contributed to making the global economy even more open and interdependent than it was in the boom times of the late nineteenth century (Baldwin and Martin 1999; Bordo, Eichengreen and Irwin 1999). 2 - Following the broadcast on US television in November 1991 of a 60 minutes segment on possible reasons for 'the French paradox' (concerning their superior health despite high levels of wine consumption), red wine sales in the US shot up 61 per cent that month and have remained higher ever since (Heien and Sims 2000). 3 - It is possible that the price downturn could be delayed if the stockholding ratio were to fall less quickly than modeled. The model projects an increase in premium red wine stocks from 364 Ml in 1998 to 631 Ml in 2003, which represents a decline in stocks as a proportion of annual production from 1.60 to 1.23. 4 - In per capita terms, in the 2003 base case, premium consumption is 4.8 litres for red premium wine and 4.5 litres for white premium wine. These levels increase to 5.4 litres and 5.2 litres, respectively, in the tax reform scenario. 5 - See Hoole (1997) for the Orlando Wyndham experience and Steiman (1999) for Southcorp's approach. Southcorp rates the grapes from every plot of land and the wine that results on a sophisticated 30-point scale, and contract growers are paid accordingly. In turn, the wine point scores are used to determine under which label (and hence price bracket) a particular batch will be sold (Steiman 1999, page 130). 6 - On the one hand, there has been a huge increase in the number of Australian wine producers (currently more than 1100, compared with fewer than 200 in the early 1970s and 300 in the early 1980s see Winetitles (1999 and earlier issues)), but most of them are very small. On the other hand, there have been numerous mergers and takeovers by larger firms to form even larger conglomerates (see Halliday (1994, p. 59) for a chronology of ownership changes since the early 1980s). The net result has been a substantial increase in firm concentration. Whereas in 1978 those crushing more than 1000 tonnes accounted for 17 per cent of wine firms, now they account for just 4 per cent of all wine firms. The top three producers now account for about 50 per cent of the annual vintage, of the number of bottles of wine sold, and of the value of domestic sales, and for 70 per cent of wine exports; for the top nine producers those shares are about 75 and 95 per cent, respectively (Osmond and Anderson (1998, Tables 11 and 12)). 7 - The corporatization of firms has helped in raising the enormous amounts of capital required for rapid expansion. The capital intensity of winegrape growing is about 50 per cent above that of other agriculture and that of winemaking is more than one-fifth higher than that of other manufacturing. 8 - Even after the huge expansion of vines in the 1990s (see Figure 1), Australia in 2000 has only 2.3% of its cropland under winegrapes. This is large relative to the 1995 shares for Chile (1.3%), Argentina (0.7%), South Africa (0.6%) and the United States (0.2%), but small relative to Portugal (8.0%), Italy (7.6%), Spain (6.1%) and France (4.5%). 9 - For a comprehensive listing of participants in the industry, and of the wide array of journals and magazines dedicated to grape and wine producer (not to mention consumer) information, see Winetitles (1999) and the websites www.winetitles.com.au and www.wineaustralia.com.au . 10 - The focus on quality upgrading is very evident even from the industry's volume data: a decade ago only 43 per cent of Australia's wine production and less than half of its exports were of premium quality (i.e., sold in bottles of a litre or less), whereas now 53 per cent of production and four-fifths of exports are premium. In value terms those differences are even larger. See Osmond and Anderson (1998). 11 - There is clearly a difference between the demand for wine and that for, say, coffee: the latter has perhaps just as much variation in flavour as wine, and yet a small number of brands market the bulk of global production. 12 - If the olive industry were to expand so that domestic production was as large as current domestic consumption, then that twenty-fold increase in production would make the olive industry a similar size to the wine industry currently. 13 - See, for example, Osmond and Anderson (1998), Berger, Anderson and Stringer (1998) and Berger, Spahni and Anderson (1999) for historical data, ABS (1999 and earlier) for annual updates including intended vineyard plantings by growers, and ABARE (1997b and subsequent years) and Wittwer and Anderson (1999) for projections five years ahead. 14 - The European Union and New Zealand each supply around one-third of global exports, and Australia supplies about one-eighth. These and other statistics on the industry are taken from www.dairycorp.com.au/adc/dairyindustry . 15 - This compares with 3 per cent in New Zealand. 16 - For details of the Dairy Industry Adjustment Program see www.afta.gov.au/diap . As of 1997-98, almost half of the net subsidy equivalent of all agricultural assistance measures in Australia was due to liquid milk policies, while another one-sixth was due to manufacturing milk support policies. Reforming those policies will probably be enough to reduce the effective rate of assistance for the agricultural sector (8.3 per cent in 1997-98) down to that for manufacturing (5 per cent in 2000-01 -- see Productivity Commission (1999)). 17 - According to SBC Warburg as quoted by Bruce Kemp at the Wine Industry Outlook Conference in Adelaide on 11 November 1999, the world market share of the top four firms is just 7 per cent in the wine industry compared with 20 per cent for beer, 44 per cent for spirits, 60 per cent for tobacco, and 78 per cent for soft drinks. |
|||||||||||||||||||||||||||||||||||||||||||||||||||||||||||||||||||||||||||||||||||||||||||||||||||||||||||||||||||||||||||||||||||||||||||||||||||||||||||||||||||||||||||||||||||||||||||||||||||||||||||||||||||||||||||||||||||||||||||||||||||||||||||||||||||||||||||||||||||||||||||||||||||||||||||||||||||||||||||||||||||||||||||||||||||||||||||||||||||||||||||||||||||||||||||||||||||||||||||||||||||||||||||||||||||||||||||||||||||||||||||||||||||||||||||||||||||||||||||||||||||||||||||||||||||||||||||||||||||||||||||||||||||||||||||||||||||||||||||||||||||||||||||||||||||||||||||||||||||||||||||||||||||||||||||||||||||||||||||||||||||||||||||||||||||||||||||||||||||||||||||||||||||||||||||||||||||||||||||||||||||||||||||||||||||||||||||||||||||||||||||||||||||||||||||||||||||||||||||||||||||||||||||||||||||||||||||||||||||||||||||||||||||||||||||||||||||||||||||||||||||||||||||||||||||||||||||||||||||||||||||||||||||||||||||||||||||||||||||||||||||||||||||||||||||||||||||||||||||||
|
Contact the University : Disclaimer & Copyright : Privacy : Accessibility |
|
Date Created: 04 June 2005 |
The University of Melbourne ABN: 84 002 705 224 
|
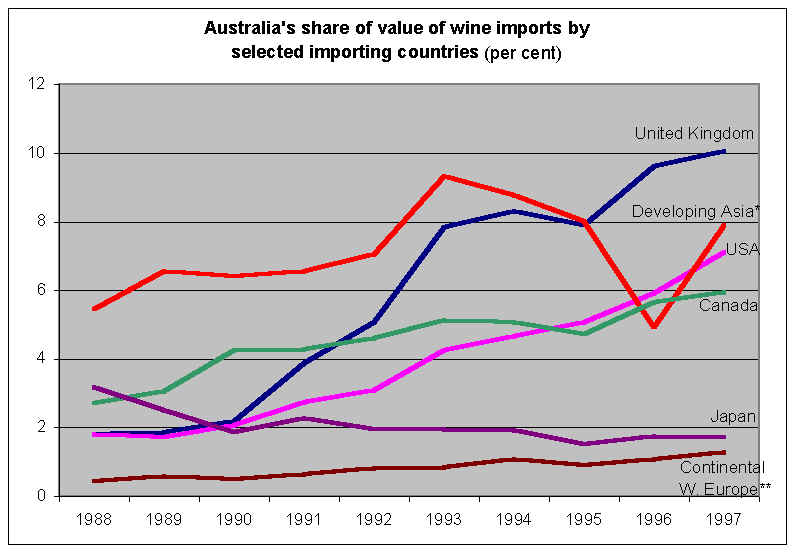
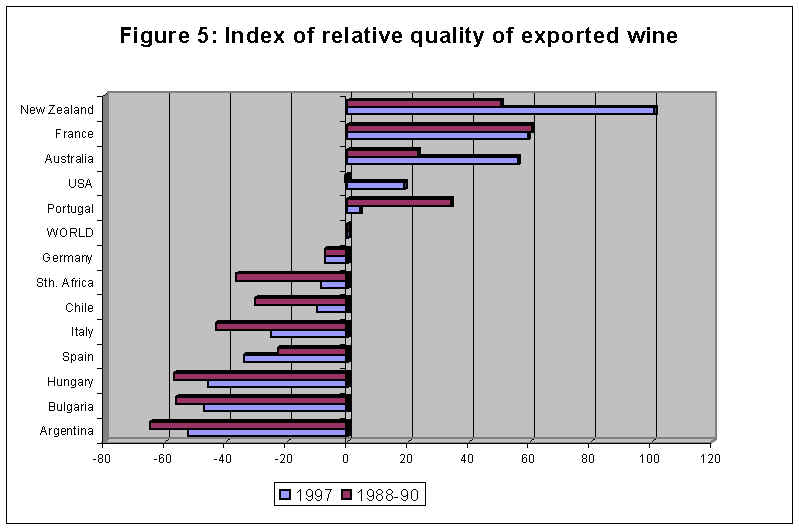